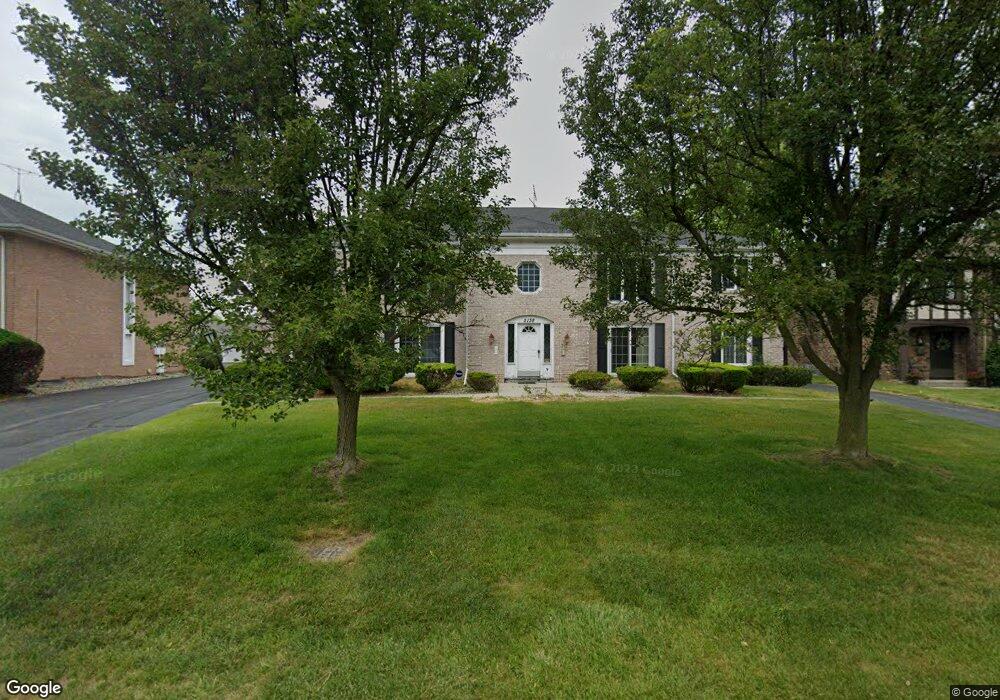
5138 Regency Dr Unit C Toledo, OH 43615
Estimated Value: $138,000 - $163,000
2
Beds
2
Baths
1,134
Sq Ft
$137/Sq Ft
Est. Value
About This Home
This home is located at 5138 Regency Dr Unit C, Toledo, OH 43615 and is currently estimated at $155,706, approximately $137 per square foot. 5138 Regency Dr Unit C is a home located in Lucas County with nearby schools including Whiteford Elementary School, Sylvania Arbor Hills Junior High School, and Sylvania Southview High School.
Ownership History
Date
Name
Owned For
Owner Type
Purchase Details
Closed on
May 3, 2010
Sold by
Gard Loren A
Bought by
Byrne Way Homes Llc
Current Estimated Value
Home Financials for this Owner
Home Financials are based on the most recent Mortgage that was taken out on this home.
Original Mortgage
$46,200
Outstanding Balance
$24,390
Interest Rate
5.16%
Mortgage Type
Future Advance Clause Open End Mortgage
Estimated Equity
$131,316
Purchase Details
Closed on
May 28, 1999
Sold by
Wallace Steven M
Bought by
Gard Loren A and Gard Dolores A
Purchase Details
Closed on
Dec 26, 1997
Sold by
Zahn Sharon L
Bought by
Wallace Steven M
Home Financials for this Owner
Home Financials are based on the most recent Mortgage that was taken out on this home.
Original Mortgage
$84,500
Interest Rate
7.38%
Mortgage Type
New Conventional
Purchase Details
Closed on
Mar 14, 1989
Sold by
Cone John P
Create a Home Valuation Report for This Property
The Home Valuation Report is an in-depth analysis detailing your home's value as well as a comparison with similar homes in the area
Home Values in the Area
Average Home Value in this Area
Purchase History
| Date | Buyer | Sale Price | Title Company |
|---|---|---|---|
| Byrne Way Homes Llc | $66,000 | Attorney | |
| Gard Loren A | $82,000 | A.R.E.A. Title Agency Inc | |
| Wallace Steven M | $89,000 | -- | |
| -- | $60,000 | -- |
Source: Public Records
Mortgage History
| Date | Status | Borrower | Loan Amount |
|---|---|---|---|
| Open | Byrne Way Homes Llc | $46,200 | |
| Previous Owner | Wallace Steven M | $84,500 |
Source: Public Records
Tax History
| Year | Tax Paid | Tax Assessment Tax Assessment Total Assessment is a certain percentage of the fair market value that is determined by local assessors to be the total taxable value of land and additions on the property. | Land | Improvement |
|---|---|---|---|---|
| 2025 | -- | $36,680 | $4,655 | $32,025 |
| 2024 | $1,228 | $36,680 | $4,655 | $32,025 |
| 2023 | $2,198 | $28,070 | $3,815 | $24,255 |
| 2022 | $2,194 | $28,070 | $3,815 | $24,255 |
| 2021 | $2,195 | $28,070 | $3,815 | $24,255 |
| 2020 | $2,165 | $23,940 | $3,780 | $20,160 |
| 2019 | $2,089 | $23,940 | $3,780 | $20,160 |
| 2018 | $2,063 | $23,940 | $3,780 | $20,160 |
| 2017 | $2,199 | $22,995 | $2,240 | $20,755 |
| 2016 | $2,158 | $65,700 | $6,400 | $59,300 |
| 2015 | $2,041 | $65,700 | $6,400 | $59,300 |
| 2014 | $1,968 | $22,760 | $2,210 | $20,550 |
| 2013 | $1,968 | $22,760 | $2,210 | $20,550 |
Source: Public Records
Map
Nearby Homes
- 5123 Regency Dr
- 15 Stableside N
- 3 Stableside S
- 2949 Secretariat Rd
- 2720 Westcastle Dr
- 4923 Cranston Dr
- 2812 Quail Run Dr
- 4709 W Bancroft St
- 4705 W Bancroft St
- 5652 Goodhue Dr
- 3521 Southpoint Rd
- 1923 Eileen Rd
- 405 N Holland Sylvania Rd
- 5815 W Bancroft St
- 3213 Waldmar Rd
- 4521 W Bancroft St
- 5665 Camberley Dr
- 4309 Brookside Rd
- 1950 Devinci Dr Unit A203
- 1966 Devinci Dr
- 5138 Regency Dr Unit D
- 5138 Regency Dr Unit B
- 5138 Regency Dr Unit A
- 5138 Regency Dr
- 5128 Regency Dr
- 5128 Regency Dr Unit B
- 5130 Regency Dr
- 5146 Regency Dr Unit 4
- 5146 Regency Dr Unit 3
- 5146 Regency Dr Unit 2
- 5146 Regency Dr Unit 1
- 5146 Regency Dr
- 5124 Regency Dr Unit D
- 5126 Regency Dr Unit C
- 5124 Regency Dr Unit B
- 5124 Regency Dr
- 5156 Regency Dr Unit 4
- 5156 Regency Dr Unit 3
- 5156 Regency Dr Unit 2
- 5156 Regency Dr Unit 1
Your Personal Tour Guide
Ask me questions while you tour the home.