S
Landlord's Agent in 2019
Scott Lindemann
American Homes 4 Rent Management
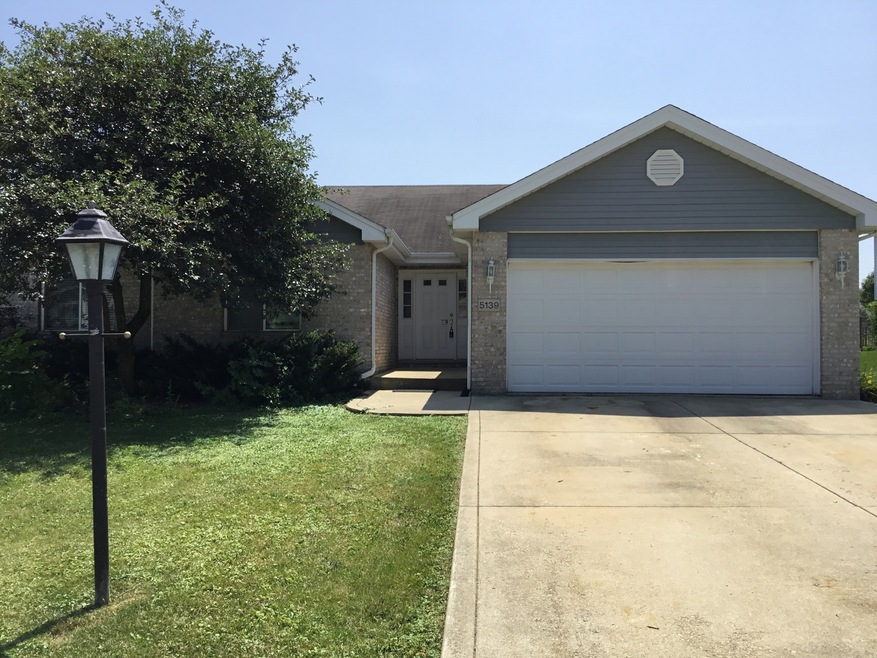
Estimated Value: $325,000
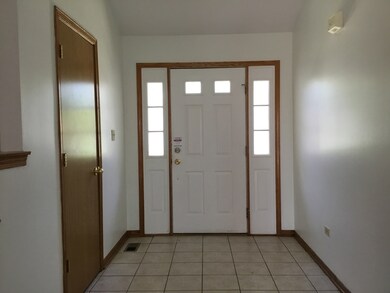
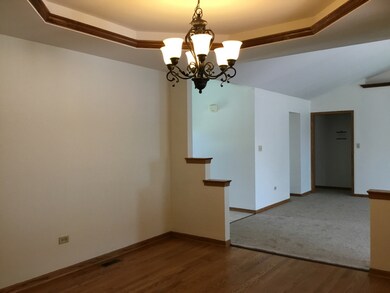
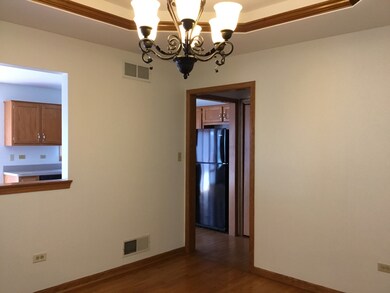
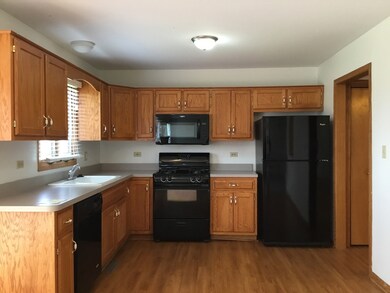
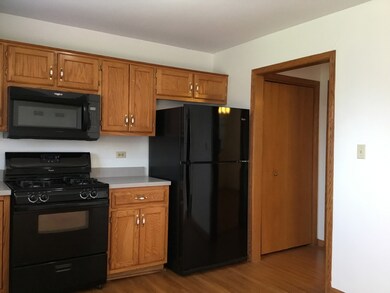
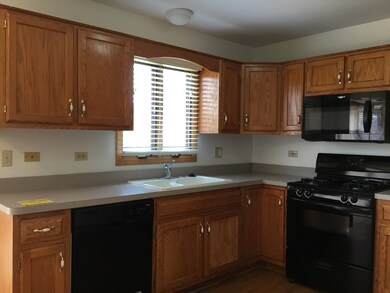
STUNNING RAISED RANCH! GREAT FLOORPLAN FOR FAMILY & ENTERTAINING! 3 BRMS, 2 BATHS HW FLRS, TREY CEILINGS, CROWN MOLDING, FIREPLACE, MSTR STE W/WHIRLPOOL, SEP SHWR & WIC. 2 CAR GARAGE!!
Last Agent to Rent the Property
Scott Lindemann
American Homes 4 Rent Management Listed on: 06/12/2019
| Date | Buyer | Sale Price | Title Company |
|---|---|---|---|
| Amh 2014-2 Borrower Llc | -- | None Available | |
| White Michael S | $147,500 | -- | |
| Nicholas Michaela T | $140,000 | -- |
| Date | Status | Borrower | Loan Amount |
|---|---|---|---|
| Previous Owner | White Michael S | $132,750 | |
| Previous Owner | Nicholas Michaela T | $100,000 |
| Date | Event | Price | List to Sale | Price per Sq Ft |
|---|---|---|---|---|
| 08/23/2019 08/23/19 | Rented | $1,895 | 0.0% | -- |
| 08/11/2019 08/11/19 | Under Contract | -- | -- | -- |
| 08/09/2019 08/09/19 | Off Market | $1,895 | -- | -- |
| 07/23/2019 07/23/19 | Price Changed | $1,895 | -5.0% | $1 / Sq Ft |
| 06/12/2019 06/12/19 | For Rent | $1,995 | -- | -- |
| Year | Tax Paid | Tax Assessment Tax Assessment Total Assessment is a certain percentage of the fair market value that is determined by local assessors to be the total taxable value of land and additions on the property. | Land | Improvement |
|---|---|---|---|---|
| 2024 | $10,255 | $98,339 | $16,561 | $81,778 |
| 2023 | $10,255 | $84,775 | $14,277 | $70,498 |
| 2022 | $8,807 | $74,573 | $12,559 | $62,014 |
| 2021 | $8,432 | $67,927 | $11,535 | $56,392 |
| 2020 | $8,425 | $65,725 | $11,161 | $54,564 |
| 2019 | $8,218 | $62,328 | $10,584 | $51,744 |
| 2018 | $8,090 | $60,459 | $10,357 | $50,102 |
| 2017 | $8,042 | $58,699 | $10,069 | $48,630 |
| 2016 | $7,633 | $54,698 | $9,722 | $44,976 |
| 2015 | $5,854 | $50,453 | $8,958 | $41,495 |
| 2014 | $5,854 | $49,756 | $8,834 | $40,922 |
| 2013 | $5,854 | $52,100 | $9,250 | $42,850 |
S
Landlord's Agent in 2019
Scott Lindemann
American Homes 4 Rent Management

Tenant's Agent in 2019
Tiesha Campbell
Coldwell Banker Realty
(708) 378-7334
1 in this area
68 Total Sales
Source: Midwest Real Estate Data (MRED)
MLS Number: 10387377
APN: 21-14-21-404-022
Disclaimer: Certain information contained herein is derived from information provided by parties other than Homes.com. All information provided is deemed reliable, but is not guaranteed to be accurate and should be independently verified.
![]() Based on information submitted to the MLS GRID. All data is obtained from various sources and may not have been verified by broker or MLS GRID. Supplied Open House Information is subject to change without notice. All information should be independently reviewed and verified for accuracy. Properties may or may not be listed by the office/agent presenting the information. Some IDX listings have been excluded from this website.
Based on information submitted to the MLS GRID. All data is obtained from various sources and may not have been verified by broker or MLS GRID. Supplied Open House Information is subject to change without notice. All information should be independently reviewed and verified for accuracy. Properties may or may not be listed by the office/agent presenting the information. Some IDX listings have been excluded from this website.
Based on information submitted to the MLS GRID
Ask me questions while you tour the home.