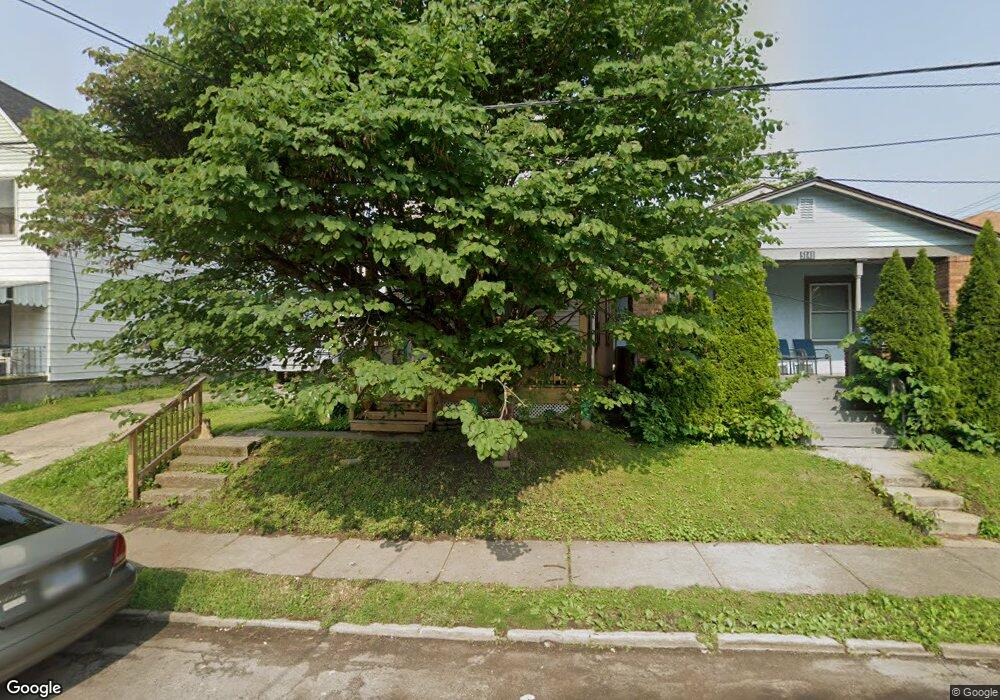
5139 Rolston Ave Cincinnati, OH 45212
Estimated Value: $151,000 - $209,648
2
Beds
1
Bath
1,399
Sq Ft
$133/Sq Ft
Est. Value
About This Home
This home is located at 5139 Rolston Ave, Cincinnati, OH 45212 and is currently estimated at $186,412, approximately $133 per square foot. 5139 Rolston Ave is a home located in Hamilton County with nearby schools including Norwood High School, Cornerstone Christian Academy, and Immaculate Conception Academy.
Ownership History
Date
Name
Owned For
Owner Type
Purchase Details
Closed on
Dec 5, 2008
Sold by
Residential Funding Real Estate Holdings
Bought by
Martin Carol
Current Estimated Value
Home Financials for this Owner
Home Financials are based on the most recent Mortgage that was taken out on this home.
Original Mortgage
$27,750
Interest Rate
6.06%
Mortgage Type
New Conventional
Purchase Details
Closed on
May 22, 2008
Sold by
Segrist Michael C
Bought by
Residential Funding Company Llc
Purchase Details
Closed on
Jan 23, 2006
Sold by
Segrist Brenda and Segrist Brenda K
Bought by
Segrist Michael C
Home Financials for this Owner
Home Financials are based on the most recent Mortgage that was taken out on this home.
Original Mortgage
$107,200
Interest Rate
8.62%
Mortgage Type
Fannie Mae Freddie Mac
Create a Home Valuation Report for This Property
The Home Valuation Report is an in-depth analysis detailing your home's value as well as a comparison with similar homes in the area
Home Values in the Area
Average Home Value in this Area
Purchase History
| Date | Buyer | Sale Price | Title Company |
|---|---|---|---|
| Martin Carol | $37,000 | None Available | |
| Residential Funding Real Estate Holdings | -- | Attorney | |
| Residential Funding Company Llc | $72,000 | None Available | |
| Segrist Michael C | -- | The Main Title Agency Inc |
Source: Public Records
Mortgage History
| Date | Status | Borrower | Loan Amount |
|---|---|---|---|
| Closed | Martin Carol | $27,750 | |
| Previous Owner | Segrist Michael C | $107,200 |
Source: Public Records
Tax History
| Year | Tax Paid | Tax Assessment Tax Assessment Total Assessment is a certain percentage of the fair market value that is determined by local assessors to be the total taxable value of land and additions on the property. | Land | Improvement |
|---|---|---|---|---|
| 2025 | $2,948 | $56,855 | $11,337 | $45,518 |
| 2023 | $2,942 | $56,855 | $11,337 | $45,518 |
| 2022 | $2,186 | $35,445 | $8,575 | $26,870 |
| 2021 | $2,117 | $35,445 | $8,575 | $26,870 |
| 2020 | $2,124 | $35,445 | $8,575 | $26,870 |
| 2019 | $2,016 | $31,091 | $7,522 | $23,569 |
| 2018 | $2,019 | $31,091 | $7,522 | $23,569 |
| 2017 | $1,907 | $31,091 | $7,522 | $23,569 |
| 2016 | $777 | $12,174 | $7,074 | $5,100 |
| 2015 | $688 | $12,174 | $7,074 | $5,100 |
| 2014 | $692 | $12,174 | $7,074 | $5,100 |
| 2013 | $728 | $12,950 | $7,525 | $5,425 |
Source: Public Records
Map
Nearby Homes
- 5121 Rolston Ave
- 5126 Globe Ave
- 5121 Silver St
- 2106 Lawn Ave
- 1933 Lawn Ave
- 5255 Rolston Ave
- 5258 Hunter Ave
- 2134 Ross Ave
- 5310 Globe Ave
- 1946 Berkley Ave
- 2141 Hannaford Ave
- 1966 Avonlea Ave
- 1832 Catalina Ave
- 2005 Crown Ave
- 1933 Northcut Ave
- 2229 Feldman Ave
- 2323 Sherwood Ln
- 2119 Cathedral Ave
- 5044 Wesley Ave
- 4719 Section Ave
- 5135 Rolston Ave
- 5141 Rolston Ave
- 5133 Rolston Ave
- 5143 Rolston Ave
- 5131 Rolston Ave
- 2023 Lawn Ave
- 5134 Warren Ave
- 5130 Warren Ave
- 5129 Rolston Ave
- 5140 Warren Ave
- 5136 Rolston Ave
- 5138 Rolston Ave
- 5132 Rolston Ave
- 5140 Rolston Ave
- 5201 Rolston Ave
- 5126 Warren Ave
- 5130 Rolston Ave
- 5142 Rolston Ave
- 5125 Rolston Ave
- 5128 Rolston Ave