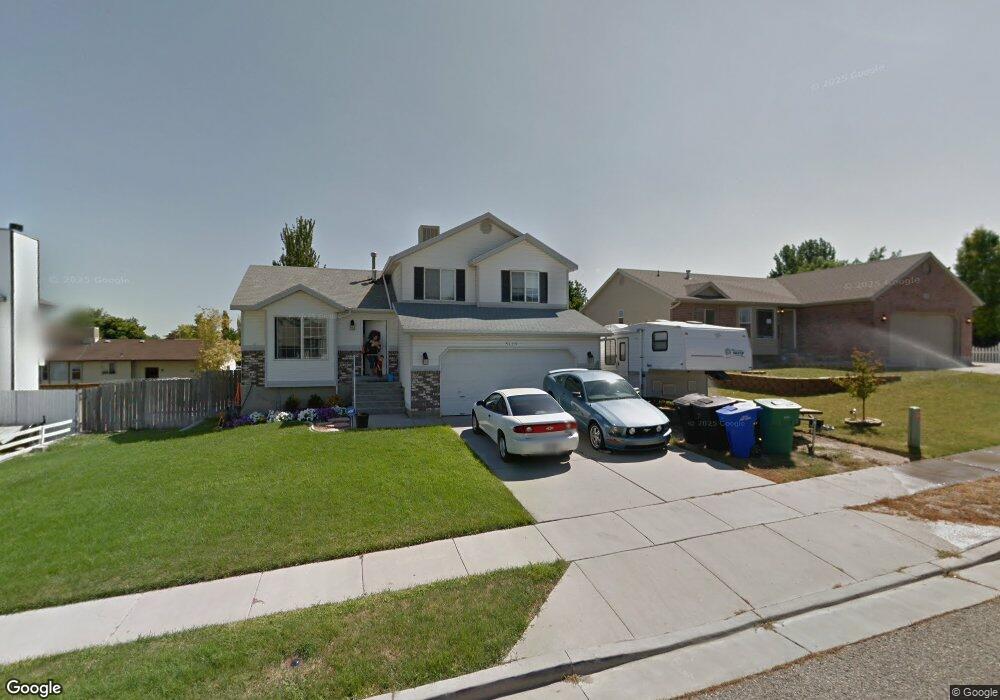
5139 W 6275 S West Jordan, UT 84081
Oquirrh NeighborhoodEstimated Value: $492,000 - $515,000
3
Beds
2
Baths
1,863
Sq Ft
$269/Sq Ft
Est. Value
About This Home
This home is located at 5139 W 6275 S, West Jordan, UT 84081 and is currently estimated at $500,393, approximately $268 per square foot. 5139 W 6275 S is a home located in Salt Lake County with nearby schools including Jim Bridger Elementary School, Thomas Jefferson Jr High School, and Kearns High School.
Ownership History
Date
Name
Owned For
Owner Type
Purchase Details
Closed on
Feb 21, 2023
Sold by
Liljenquist Stephen and Liljenquist Kelsey
Bought by
Gwilliam Kevin Allen
Current Estimated Value
Home Financials for this Owner
Home Financials are based on the most recent Mortgage that was taken out on this home.
Original Mortgage
$465,465
Outstanding Balance
$451,252
Interest Rate
6.48%
Mortgage Type
VA
Estimated Equity
$49,141
Purchase Details
Closed on
Nov 11, 2014
Sold by
Nickel Chad and Nickel Dalainee
Bought by
Liljenquist Stephen and Liljenquist Kelsey
Home Financials for this Owner
Home Financials are based on the most recent Mortgage that was taken out on this home.
Original Mortgage
$197,600
Interest Rate
4.16%
Mortgage Type
New Conventional
Purchase Details
Closed on
Jul 29, 2005
Sold by
Kendall Brooke E and Kendall Rosalba
Bought by
Nickel Chad and Garica Dalainee
Home Financials for this Owner
Home Financials are based on the most recent Mortgage that was taken out on this home.
Original Mortgage
$5,380
Interest Rate
5.56%
Mortgage Type
Stand Alone Second
Purchase Details
Closed on
Jan 24, 2003
Sold by
Kendall Brooke E and Calderon Rosalba
Bought by
Kendall Brooke E and Kendall Rosalba
Home Financials for this Owner
Home Financials are based on the most recent Mortgage that was taken out on this home.
Original Mortgage
$148,100
Interest Rate
5.97%
Mortgage Type
FHA
Purchase Details
Closed on
Apr 22, 2002
Sold by
Thomas Evan and Thomas Jill
Bought by
Kendall Brooke E and Calderon Rosalba
Home Financials for this Owner
Home Financials are based on the most recent Mortgage that was taken out on this home.
Original Mortgage
$147,682
Interest Rate
7.08%
Mortgage Type
FHA
Purchase Details
Closed on
Dec 2, 1999
Sold by
Plaster Kari Melissa
Bought by
Thomas Evan and Thomas Jill
Home Financials for this Owner
Home Financials are based on the most recent Mortgage that was taken out on this home.
Original Mortgage
$103,500
Interest Rate
7.95%
Purchase Details
Closed on
Nov 24, 1997
Sold by
Hall John K and Hall Stacy R
Bought by
Plaster Kari Melissa
Home Financials for this Owner
Home Financials are based on the most recent Mortgage that was taken out on this home.
Original Mortgage
$124,325
Interest Rate
7.23%
Mortgage Type
FHA
Purchase Details
Closed on
Nov 3, 1995
Sold by
Rochelle Development Lc
Bought by
Hall John K and Hall Stacy R
Home Financials for this Owner
Home Financials are based on the most recent Mortgage that was taken out on this home.
Original Mortgage
$103,500
Interest Rate
7.58%
Create a Home Valuation Report for This Property
The Home Valuation Report is an in-depth analysis detailing your home's value as well as a comparison with similar homes in the area
Home Values in the Area
Average Home Value in this Area
Purchase History
| Date | Buyer | Sale Price | Title Company |
|---|---|---|---|
| Gwilliam Kevin Allen | -- | First American Title | |
| Liljenquist Stephen | -- | Benchmark Title Ins Agcy | |
| Nickel Chad | -- | Surety Title | |
| Kendall Brooke E | -- | Meridian Title | |
| Kendall Brooke E | -- | Metro National Title | |
| Thomas Evan | -- | First American Title Ins Co | |
| Plaster Kari Melissa | -- | -- | |
| Hall John K | -- | -- |
Source: Public Records
Mortgage History
| Date | Status | Borrower | Loan Amount |
|---|---|---|---|
| Open | Gwilliam Kevin Allen | $465,465 | |
| Previous Owner | Liljenquist Stephen | $197,600 | |
| Previous Owner | Nickel Chad | $5,380 | |
| Previous Owner | Nickel Chad | $159,497 | |
| Previous Owner | Kendall Brooke E | $148,100 | |
| Previous Owner | Kendall Brooke E | $147,682 | |
| Previous Owner | Thomas Evan | $103,500 | |
| Previous Owner | Plaster Kari Melissa | $124,325 | |
| Previous Owner | Hall John K | $103,500 |
Source: Public Records
Tax History Compared to Growth
Tax History
| Year | Tax Paid | Tax Assessment Tax Assessment Total Assessment is a certain percentage of the fair market value that is determined by local assessors to be the total taxable value of land and additions on the property. | Land | Improvement |
|---|---|---|---|---|
| 2025 | $2,876 | $480,300 | $121,000 | $359,300 |
| 2024 | $2,876 | $453,400 | $114,100 | $339,300 |
| 2023 | $2,876 | $409,500 | $109,700 | $299,800 |
| 2022 | $2,660 | $406,200 | $107,600 | $298,600 |
| 2021 | $2,436 | $330,700 | $82,700 | $248,000 |
| 2020 | $2,249 | $288,500 | $82,700 | $205,800 |
| 2019 | $2,204 | $274,700 | $78,100 | $196,600 |
| 2018 | $2,107 | $253,600 | $78,100 | $175,500 |
| 2017 | $1,884 | $238,700 | $78,100 | $160,600 |
| 2016 | $1,721 | $216,500 | $78,100 | $138,400 |
| 2015 | $1,649 | $193,100 | $77,800 | $115,300 |
| 2014 | $1,538 | $176,700 | $75,500 | $101,200 |
Source: Public Records
Map
Nearby Homes
- 6157 S Impressions Dr
- 6398 S Lobelia Dr
- 6437 S Lobelia Dr
- 5071 W Jarrad Rd
- 5352 Cassatt Cir
- 5382 W Northlilac Ave
- 5275 Ridge Flower Way
- 5285 Ridge Flower Way
- 6568 S 5180 W
- 6022 S Park Wood Dr W
- 6489 S Daffodil Way
- 6635 S Milfoil Cir
- 5924 S Cami Dawn Ct
- 4909 Sakura Ct
- 5183 W Cadenza Dr
- 5365 W Alpine Flower Cir
- 5960 S Tumerick Ct
- 5343 W Ridge Brook Way
- 6160 S Miramonte Way Unit T-30
- 6706 Marshrock Rd
- 5153 W 6275 S
- 5136 W Cyclamen Way
- 5136 Cyclamen Way
- 5167 W 6275 S
- 5123 W 6275 S
- 5138 W 6275 S
- 5154 W 6275 S
- 5120 Cyclamen Way
- 5120 W Cyclamen Way
- 5128 Cyclamen Way
- 5122 W 6275 S
- 6267 S Waller Ln
- 5113 W 6275 S
- 5173 W 6275 S
- 5144 W Cyclamen Way
- 6254 S 5130 W
- 5144 Cyclamen Way
- 5110 W Cyclamen Way
- 5110 Cyclamen Way
- 6257 Waller Ln