514 2nd St Unit 1 Libertyville, IL 60048
Estimated Value: $260,000 - $390,186
2
Beds
1
Bath
844
Sq Ft
$405/Sq Ft
Est. Value
About This Home
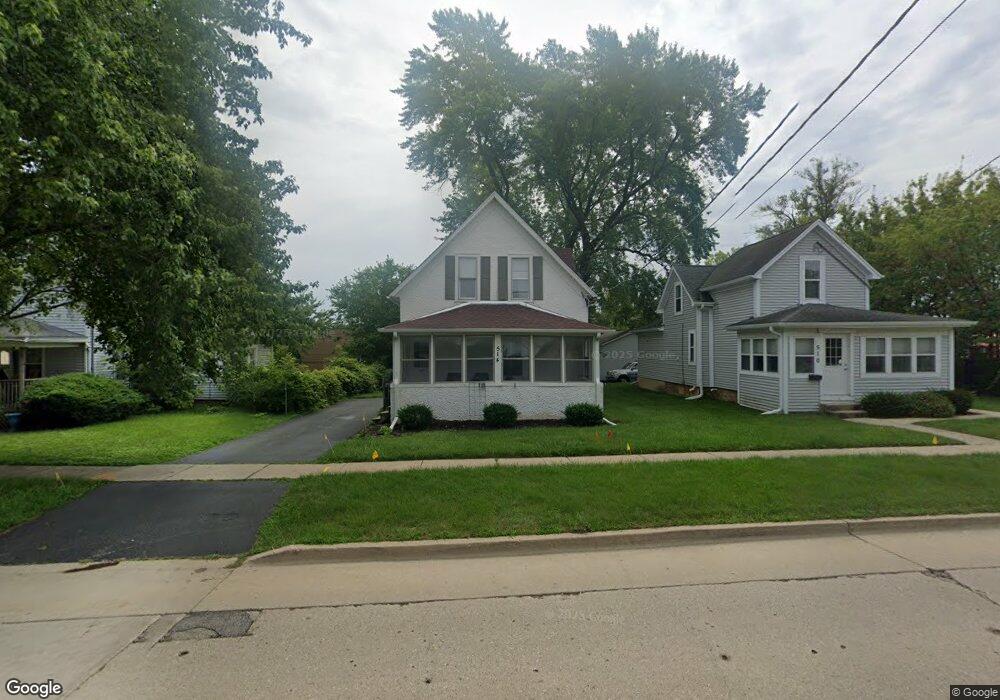
This home is located at 514 2nd St Unit 1, Libertyville, IL 60048 and is currently estimated at $342,047, approximately $405 per square foot. 514 2nd St Unit 1 is a home located in Lake County with nearby schools including Butterfield School, Highland Middle School, and Libertyville High School.
Ownership History
Date
Name
Owned For
Owner Type
Purchase Details
Closed on
Nov 28, 2018
Sold by
Smutney Karl R
Bought by
Berg Holdings Inc
Current Estimated Value
Home Financials for this Owner
Home Financials are based on the most recent Mortgage that was taken out on this home.
Original Mortgage
$255,000
Interest Rate
2.95%
Mortgage Type
Commercial
Purchase Details
Closed on
Nov 20, 2012
Sold by
Federal National Mortgage Association
Bought by
Smutney Kari
Purchase Details
Closed on
Apr 10, 2012
Sold by
Hartshorne Mary Angela and Hartshorne Angela M
Bought by
Federal National Mortgage Association
Purchase Details
Closed on
Oct 20, 1995
Sold by
Kidwell Larry B and Kidwell Karen E
Bought by
Hartshorne Thomas H and Hartshorne Angela M
Home Financials for this Owner
Home Financials are based on the most recent Mortgage that was taken out on this home.
Original Mortgage
$114,008
Interest Rate
7.65%
Mortgage Type
FHA
Create a Home Valuation Report for This Property
The Home Valuation Report is an in-depth analysis detailing your home's value as well as a comparison with similar homes in the area
Home Values in the Area
Average Home Value in this Area
Purchase History
| Date | Buyer | Sale Price | Title Company |
|---|---|---|---|
| Berg Holdings Inc | $340,000 | Attorneys Titie Guaranty Fun | |
| Smutney Kari | -- | Premier Title | |
| Federal National Mortgage Association | -- | Premier Title | |
| Hartshorne Thomas H | $115,000 | -- |
Source: Public Records
Mortgage History
| Date | Status | Borrower | Loan Amount |
|---|---|---|---|
| Closed | Berg Holdings Inc | $255,000 | |
| Previous Owner | Hartshorne Thomas H | $114,008 |
Source: Public Records
Tax History Compared to Growth
Tax History
| Year | Tax Paid | Tax Assessment Tax Assessment Total Assessment is a certain percentage of the fair market value that is determined by local assessors to be the total taxable value of land and additions on the property. | Land | Improvement |
|---|---|---|---|---|
| 2024 | $2,587 | $67,005 | $40,398 | $26,607 |
| 2023 | $2,587 | $61,802 | $37,261 | $24,541 |
| 2022 | $4,781 | $59,778 | $51,969 | $7,809 |
| 2021 | $4,607 | $58,491 | $50,850 | $7,641 |
| 2020 | $4,436 | $57,508 | $49,995 | $7,513 |
| 2019 | $5,570 | $73,351 | $55,275 | $18,076 |
| 2018 | $4,551 | $61,915 | $57,500 | $4,415 |
| 2017 | $4,524 | $59,961 | $55,685 | $4,276 |
| 2016 | $5,939 | $77,606 | $52,797 | $24,809 |
| 2015 | $5,902 | $72,536 | $49,348 | $23,188 |
| 2014 | $2,332 | $28,084 | $18,350 | $9,734 |
| 2012 | $4,957 | $68,202 | $46,399 | $21,803 |
Source: Public Records
Map
Nearby Homes
- 224 Newberry Ave
- 217 E Church St
- 601 Broadway St
- 121 4th St
- 112 3rd St
- 922 N Milwaukee Ave Unit A
- 212 Elm Ct
- 1211 Parliament Ct
- 505 Lange Ct
- 204 W Ellis Ave
- 420 W Cook Ave
- 208 W Ellis Ave
- 212 W Ellis Ave
- 401 S 4th Ave
- 1754 Glenmore Rd
- 785 Meadow Ln
- 308 Mckinley Ave
- 426 S Milwaukee Ave
- 619 Parkside Ct
- 616 Parkside Ct