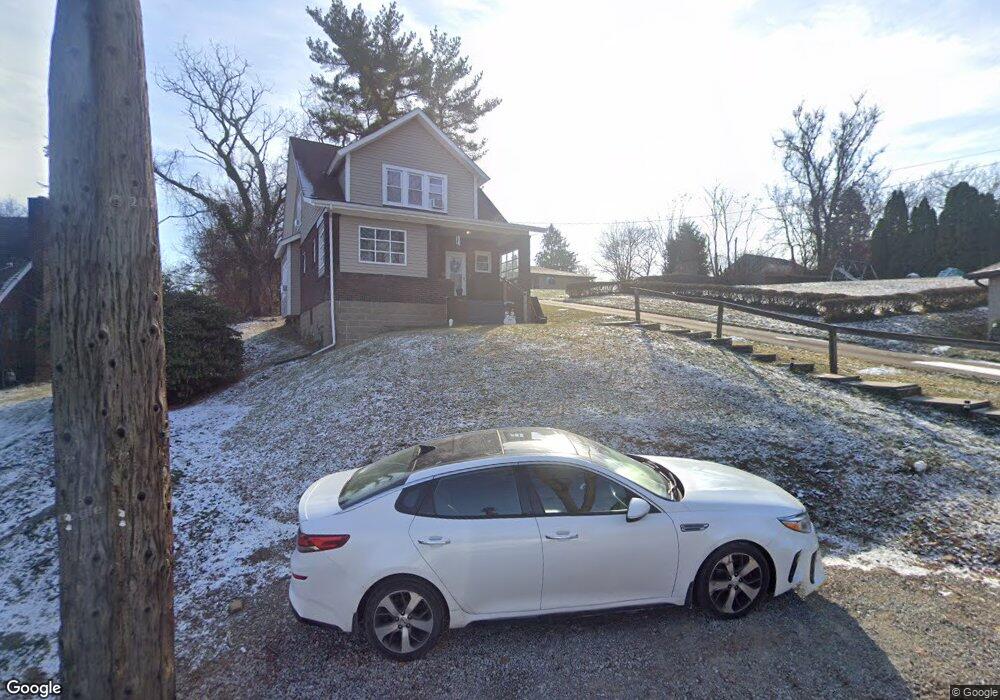
514 3rd St North Versailles, PA 15137
Estimated Value: $183,000 - $239,270
3
Beds
2
Baths
1,553
Sq Ft
$129/Sq Ft
Est. Value
About This Home
This home is located at 514 3rd St, North Versailles, PA 15137 and is currently estimated at $200,068, approximately $128 per square foot. 514 3rd St is a home located in Allegheny County with nearby schools including Logan Elementary School, Propel Cs-East, and Praise Christian Academy.
Ownership History
Date
Name
Owned For
Owner Type
Purchase Details
Closed on
Sep 3, 2013
Sold by
Hoke Rory T
Bought by
Nesky John H
Current Estimated Value
Home Financials for this Owner
Home Financials are based on the most recent Mortgage that was taken out on this home.
Original Mortgage
$88,000
Outstanding Balance
$65,720
Interest Rate
4.42%
Mortgage Type
New Conventional
Estimated Equity
$134,348
Purchase Details
Closed on
Aug 12, 1981
Bought by
Hoke Rory T
Create a Home Valuation Report for This Property
The Home Valuation Report is an in-depth analysis detailing your home's value as well as a comparison with similar homes in the area
Home Values in the Area
Average Home Value in this Area
Purchase History
| Date | Buyer | Sale Price | Title Company |
|---|---|---|---|
| Nesky John H | $110,000 | -- | |
| Hoke Rory T | $49,900 | -- |
Source: Public Records
Mortgage History
| Date | Status | Borrower | Loan Amount |
|---|---|---|---|
| Open | Nesky John H | $88,000 |
Source: Public Records
Tax History Compared to Growth
Tax History
| Year | Tax Paid | Tax Assessment Tax Assessment Total Assessment is a certain percentage of the fair market value that is determined by local assessors to be the total taxable value of land and additions on the property. | Land | Improvement |
|---|---|---|---|---|
| 2025 | $3,630 | $92,000 | $21,400 | $70,600 |
| 2024 | $3,630 | $92,000 | $21,400 | $70,600 |
| 2023 | $3,630 | $92,000 | $21,400 | $70,600 |
| 2022 | $3,630 | $92,000 | $21,400 | $70,600 |
| 2021 | $435 | $92,000 | $21,400 | $70,600 |
| 2020 | $3,630 | $92,000 | $21,400 | $70,600 |
| 2019 | $3,630 | $92,000 | $21,400 | $70,600 |
| 2018 | $435 | $92,000 | $21,400 | $70,600 |
| 2017 | $3,630 | $92,000 | $21,400 | $70,600 |
| 2016 | $435 | $92,000 | $21,400 | $70,600 |
| 2015 | $435 | $92,000 | $21,400 | $70,600 |
| 2014 | $3,682 | $92,000 | $21,400 | $70,600 |
Source: Public Records
Map
Nearby Homes