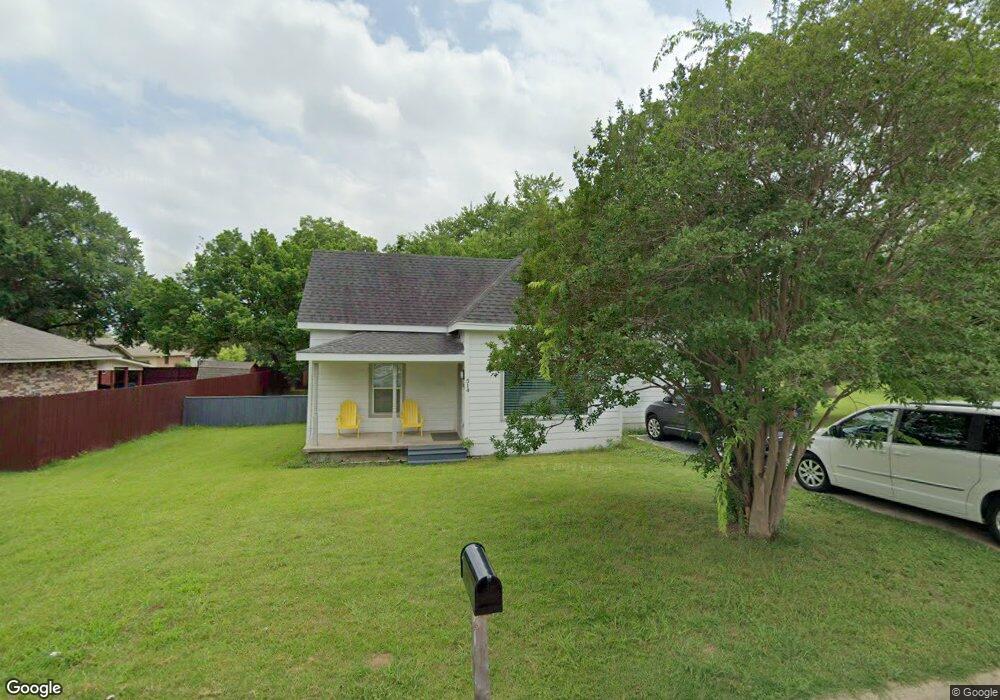
514 Baker St Denison, TX 75020
Estimated Value: $156,020 - $162,000
Studio
--
Bath
896
Sq Ft
$177/Sq Ft
Est. Value
About This Home
This home is located at 514 Baker St, Denison, TX 75020 and is currently estimated at $159,010, approximately $177 per square foot. 514 Baker St is a home located in Grayson County with nearby schools including Scott Middle School, Denison High School, and St. Luke's Parish Day School.
Ownership History
Date
Name
Owned For
Owner Type
Purchase Details
Closed on
Jul 28, 2025
Sold by
Maztex Homes Llc
Bought by
Ramirez Alexis and Johnston Eric
Current Estimated Value
Home Financials for this Owner
Home Financials are based on the most recent Mortgage that was taken out on this home.
Original Mortgage
$162,011
Outstanding Balance
$161,873
Interest Rate
6.81%
Mortgage Type
FHA
Estimated Equity
-$2,863
Purchase Details
Closed on
Dec 14, 2021
Sold by
Eagle Qrp Holdings Llc
Bought by
Maztex Homes Llc
Home Financials for this Owner
Home Financials are based on the most recent Mortgage that was taken out on this home.
Original Mortgage
$112,400
Interest Rate
3.09%
Mortgage Type
Purchase Money Mortgage
Purchase Details
Closed on
Oct 25, 2011
Sold by
Smith Larry J
Bought by
Smith William
Create a Home Valuation Report for This Property
The Home Valuation Report is an in-depth analysis detailing your home's value as well as a comparison with similar homes in the area
Home Values in the Area
Average Home Value in this Area
Purchase History
| Date | Buyer | Sale Price | Title Company |
|---|---|---|---|
| Ramirez Alexis | -- | Chicago Title | |
| Maztex Homes Llc | -- | Chicago Title Of Texas | |
| Smith William | -- | None Available |
Source: Public Records
Mortgage History
| Date | Status | Borrower | Loan Amount |
|---|---|---|---|
| Open | Ramirez Alexis | $162,011 | |
| Previous Owner | Maztex Homes Llc | $112,400 |
Source: Public Records
Tax History
| Year | Tax Paid | Tax Assessment Tax Assessment Total Assessment is a certain percentage of the fair market value that is determined by local assessors to be the total taxable value of land and additions on the property. | Land | Improvement |
|---|---|---|---|---|
| 2025 | $3,149 | $143,350 | $48,347 | $95,003 |
| 2024 | $3,149 | $135,533 | $39,469 | $96,064 |
| 2023 | $2,783 | $122,820 | $44,655 | $78,165 |
| 2022 | $3,014 | $126,854 | $44,655 | $82,199 |
| 2021 | $2,676 | $106,085 | $17,229 | $88,856 |
| 2020 | $1,327 | $50,325 | $13,186 | $37,139 |
| 2019 | $1,343 | $48,811 | $13,186 | $35,625 |
| 2018 | $1,166 | $42,026 | $7,032 | $34,994 |
| 2017 | $1,001 | $35,795 | $3,780 | $32,015 |
| 2016 | $904 | $32,325 | $3,780 | $28,545 |
| 2015 | $840 | $29,743 | $3,780 | $25,963 |
| 2014 | $840 | $29,743 | $3,780 | $25,963 |
Source: Public Records
Map
Nearby Homes
- 611 W Baker St
- 501 W Collins St
- 618 Star St
- 2526 S Fannin Ave Unit 2600
- 614 Rice St
- 701 W Star St
- 711 Dubois St
- 2931 S Barrett Ave
- 513 W Coffin St
- 509 W Coffin St
- 603 W Star St
- 901 Dubois St
- 2000 S Fannin Ave
- 916 W Collins St
- 929 W Collins St
- 905 Seymore Cir
- 516 Forrest Ln
- 124 Mark Dr
- 125 Mark Dr
- 153 Circle Dr
Your Personal Tour Guide
Ask me questions while you tour the home.