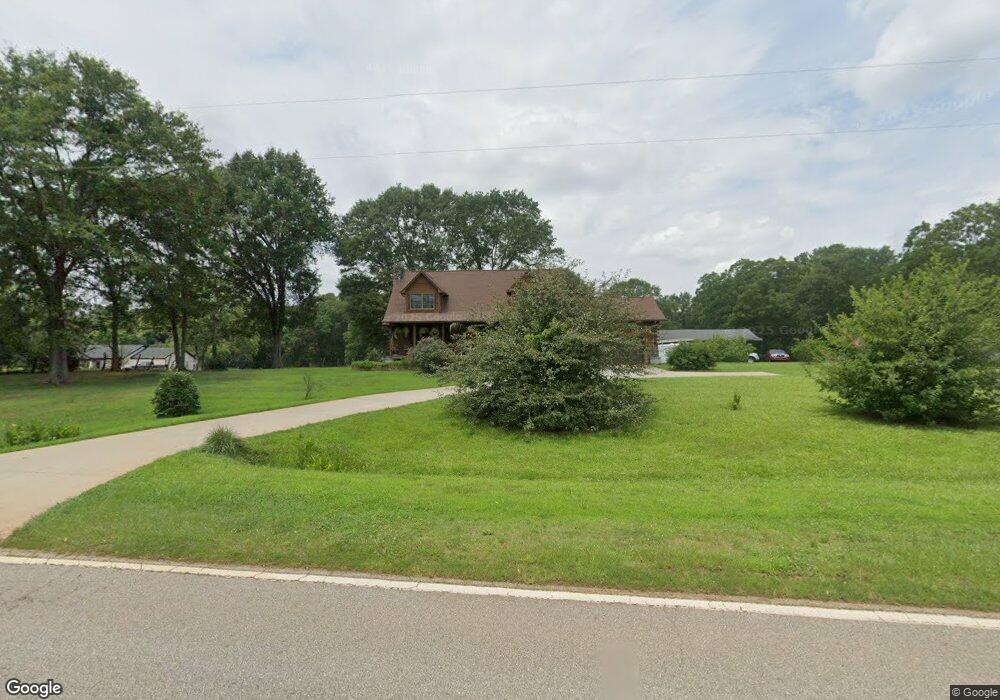
514 Dunahoo Rd Winder, GA 30680
Estimated Value: $315,000 - $430,000
4
Beds
2
Baths
1,848
Sq Ft
$207/Sq Ft
Est. Value
About This Home
This home is located at 514 Dunahoo Rd, Winder, GA 30680 and is currently estimated at $382,741, approximately $207 per square foot. 514 Dunahoo Rd is a home located in Barrow County with nearby schools including Holsenbeck Elementary School, Bear Creek Middle School, and Winder-Barrow High School.
Ownership History
Date
Name
Owned For
Owner Type
Purchase Details
Closed on
Feb 12, 2010
Sold by
Federal Home Loan Mortgage Corporation
Bought by
Coile Thomas M and Shumate Mary
Current Estimated Value
Home Financials for this Owner
Home Financials are based on the most recent Mortgage that was taken out on this home.
Original Mortgage
$56,000
Interest Rate
5.07%
Mortgage Type
New Conventional
Purchase Details
Closed on
Jun 2, 2009
Sold by
And Baynard Dion
Bought by
Citimortgage Inc
Purchase Details
Closed on
Mar 1, 2008
Sold by
Baynard Dion
Bought by
Lea-Wade Jeanette
Purchase Details
Closed on
Sep 28, 2007
Sold by
Baynard Dion
Bought by
Baynard Dion and Bekele Yafet
Purchase Details
Closed on
Mar 4, 2007
Sold by
Mincey Steven J
Bought by
And Baynard Dion
Purchase Details
Closed on
Jan 27, 2005
Sold by
Mincey Steve J
Bought by
Mincey Steven J
Create a Home Valuation Report for This Property
The Home Valuation Report is an in-depth analysis detailing your home's value as well as a comparison with similar homes in the area
Home Values in the Area
Average Home Value in this Area
Purchase History
| Date | Buyer | Sale Price | Title Company |
|---|---|---|---|
| Coile Thomas M | -- | -- | |
| Citimortgage Inc | -- | -- | |
| Lea-Wade Jeanette | -- | -- | |
| Baynard Dion | -- | -- | |
| And Baynard Dion | -- | -- | |
| Mincey Steven J | -- | -- |
Source: Public Records
Mortgage History
| Date | Status | Borrower | Loan Amount |
|---|---|---|---|
| Closed | Coile Thomas M | $56,000 |
Source: Public Records
Tax History Compared to Growth
Tax History
| Year | Tax Paid | Tax Assessment Tax Assessment Total Assessment is a certain percentage of the fair market value that is determined by local assessors to be the total taxable value of land and additions on the property. | Land | Improvement |
|---|---|---|---|---|
| 2024 | $3,215 | $133,964 | $23,820 | $110,144 |
| 2023 | $2,787 | $133,964 | $23,820 | $110,144 |
| 2022 | $2,815 | $102,130 | $23,820 | $78,310 |
| 2021 | $2,652 | $91,261 | $19,056 | $72,205 |
| 2020 | $2,443 | $84,099 | $18,000 | $66,099 |
| 2019 | $2,485 | $84,099 | $18,000 | $66,099 |
| 2018 | $2,457 | $84,099 | $18,000 | $66,099 |
| 2017 | $2,220 | $76,251 | $18,000 | $58,251 |
| 2016 | $2,123 | $74,152 | $18,000 | $56,152 |
| 2015 | $2,150 | $74,714 | $18,000 | $56,714 |
| 2014 | $1,926 | $66,096 | $8,820 | $57,276 |
| 2013 | -- | $62,726 | $8,820 | $53,906 |
Source: Public Records
Map
Nearby Homes
- 173 Equestrian Walk
- 867 Windward Rd
- 662 Carla Ct
- 508 Pleasant Hill Church Rd NE
- 273 Greystone Ct
- 63 Delightful Way Unit 1
- 162 Delightful Way Unit 28
- 0 Hancock Bridge Rd Unit 10535063
- 388 Kay Dr Unit 1
- 230 Delightful Way Unit 23
- 203 Delightful Way Unit 5
- 1556 Shoal Creek Dr
- 253 Delightful Way Unit 6
- 296 Delightful Way Unit 22
- 281 Delightful Way Unit 7
- 547 Hickeria Way
- 1553 Shoal Creek Dr
- 91 Beech Creek Cir
- 421 Arrowhatchee Dr
- 917 Justin Dr Unit 3