Estimated Value: $169,520 - $195,000
3
Beds
2
Baths
1,369
Sq Ft
$131/Sq Ft
Est. Value
About This Home
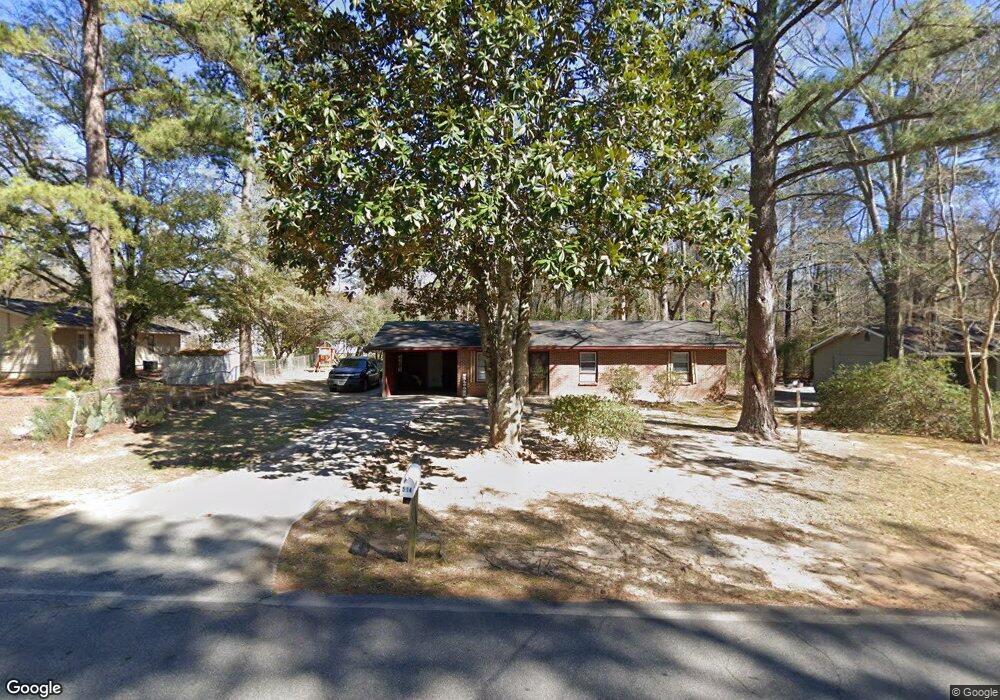
This home is located at 514 Frank Satterfield Rd, Perry, GA 31069 and is currently estimated at $179,130, approximately $130 per square foot. 514 Frank Satterfield Rd is a home located in Houston County with nearby schools including Tucker Elementary School, Perry Middle School, and Perry High School.
Ownership History
Date
Name
Owned For
Owner Type
Purchase Details
Closed on
Jun 4, 2004
Sold by
Willingham Edward W
Bought by
Key Shawn and Key Teresa
Current Estimated Value
Purchase Details
Closed on
Jul 29, 1997
Sold by
Willingham Barbara Ann
Bought by
Willingham Edward W
Purchase Details
Closed on
Mar 20, 1997
Sold by
Willingham Edward W
Bought by
Willingham Edward W and Barbara Ann
Purchase Details
Closed on
Apr 28, 1993
Sold by
Black Charles T
Bought by
Black Charles T and Black Martha*
Purchase Details
Closed on
Feb 22, 1973
Sold by
Parker Homer G
Bought by
Black Charles T
Purchase Details
Closed on
Dec 21, 1970
Sold by
Jones George
Bought by
Parker Homer G
Purchase Details
Closed on
Sep 17, 1970
Sold by
Cameron M H
Bought by
Jones George
Purchase Details
Closed on
Nov 11, 1969
Sold by
Warner Developers Inc
Bought by
Cameron M H
Purchase Details
Closed on
Oct 11, 1968
Sold by
Community Realty Inc
Bought by
Warner Developers Inc
Create a Home Valuation Report for This Property
The Home Valuation Report is an in-depth analysis detailing your home's value as well as a comparison with similar homes in the area
Home Values in the Area
Average Home Value in this Area
Purchase History
| Date | Buyer | Sale Price | Title Company |
|---|---|---|---|
| Key Shawn | $63,500 | -- | |
| Willingham Edward W | -- | -- | |
| Willingham Edward W | -- | -- | |
| Willingham Edward W | $54,000 | -- | |
| Black Charles T | -- | -- | |
| Black Charles T | -- | -- | |
| Parker Homer G | -- | -- | |
| Jones George | -- | -- | |
| Cameron M H | -- | -- | |
| Warner Developers Inc | -- | -- |
Source: Public Records
Tax History
| Year | Tax Paid | Tax Assessment Tax Assessment Total Assessment is a certain percentage of the fair market value that is determined by local assessors to be the total taxable value of land and additions on the property. | Land | Improvement |
|---|---|---|---|---|
| 2025 | $1,434 | $47,680 | $8,000 | $39,680 |
| 2024 | $1,545 | $43,280 | $8,000 | $35,280 |
| 2023 | $1,296 | $36,280 | $8,000 | $28,280 |
| 2022 | $630 | $29,400 | $4,000 | $25,400 |
| 2021 | $571 | $26,680 | $4,000 | $22,680 |
| 2020 | $559 | $26,080 | $4,000 | $22,080 |
| 2019 | $559 | $26,080 | $4,000 | $22,080 |
| 2018 | $559 | $26,080 | $4,000 | $22,080 |
| 2017 | $560 | $26,080 | $4,000 | $22,080 |
| 2016 | $561 | $26,080 | $4,000 | $22,080 |
| 2015 | $562 | $26,080 | $4,000 | $22,080 |
| 2014 | -- | $26,080 | $4,000 | $22,080 |
| 2013 | -- | $26,280 | $4,000 | $22,280 |
Source: Public Records
Map
Nearby Homes
- 1423 Tucker Rd
- 118 Constance Ct
- 117 Constance Ct
- 107 Water Run Way
- 214 Farmland Cir
- 105 Pridgen Pass
- 203 Farrell Way
- 214 Farmland Cir Unit LOT 8 AG
- 1432 Duncan Ave
- 614 Hillcrest Ave
- 625 Cooper St
- 624 Pine Ridge St
- 1207 Tucker Rd
- 634 Pine Ridge St
- 2015 Tucker Rd
- 1200 Golden Isles Pkwy
- 903 Massee Ln
- 219 Ivy Glen Dr
- 0 Carroll Aly
- 103 Gnome Ct
- 500 Cherokee Ct
- 512 Frank Satterfield Rd
- 1 Frank Satterfield Rd
- 502 Cherokee Ct
- 510 Frank Satterfield Rd
- 504 Cherokee Ct
- 501 Cherokee Ct
- 501 Frank Satterfield Rd
- 503 Cherokee Ct
- 508 Frank Satterfield Rd
- 506 Cherokee Ct
- 520 Frank Satterfield Rd
- 505 Cherokee Ct
- 506 Frank Satterfield Rd
- 508 Cherokee Ct
- 500 Seminole St
- 507 Cherokee Ct
- 502 Seminole St
- 417 Frank Satterfield Rd
- 510 Cherokee Ct
Your Personal Tour Guide
Ask me questions while you tour the home.