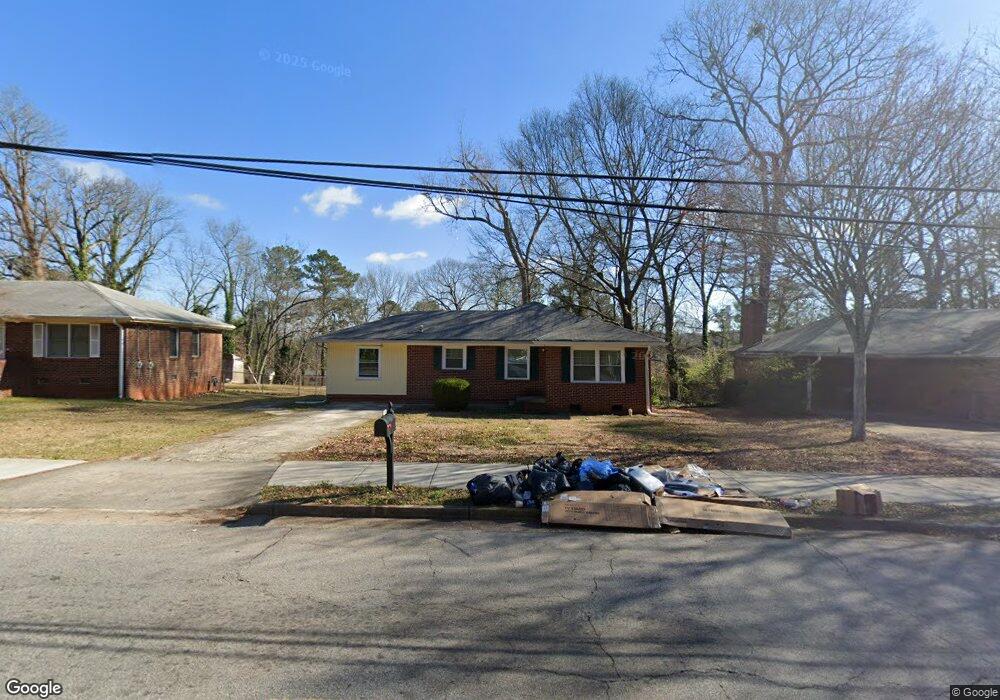
514 Hutchens Rd SE Unit 1 Atlanta, GA 30354
South River Gardens NeighborhoodEstimated Value: $189,386 - $240,000
3
Beds
1
Bath
1,348
Sq Ft
$165/Sq Ft
Est. Value
About This Home
This home is located at 514 Hutchens Rd SE Unit 1, Atlanta, GA 30354 and is currently estimated at $222,597, approximately $165 per square foot. 514 Hutchens Rd SE Unit 1 is a home located in Fulton County with nearby schools including Humphries Elementary School, Long Middle School, and South Atlanta High School.
Ownership History
Date
Name
Owned For
Owner Type
Purchase Details
Closed on
Dec 19, 2024
Sold by
Hsieh Richard
Bought by
514 Hutchens Llc
Current Estimated Value
Purchase Details
Closed on
Mar 31, 2022
Sold by
Matthews Dexter
Bought by
Southern State Investments Llc
Purchase Details
Closed on
Aug 6, 2002
Sold by
Washington Mutual Bank Fa
Bought by
Hud & Housing Of Urban Development
Purchase Details
Closed on
Aug 31, 1999
Sold by
Rainey Edward L and Rainey Gloria J
Bought by
Turner Shiela
Home Financials for this Owner
Home Financials are based on the most recent Mortgage that was taken out on this home.
Original Mortgage
$79,000
Interest Rate
7.85%
Mortgage Type
FHA
Purchase Details
Closed on
Jun 25, 1993
Sold by
Secretary Of Va
Bought by
Rainey Edward L Gloria J
Home Financials for this Owner
Home Financials are based on the most recent Mortgage that was taken out on this home.
Original Mortgage
$47,000
Interest Rate
7%
Mortgage Type
VA
Create a Home Valuation Report for This Property
The Home Valuation Report is an in-depth analysis detailing your home's value as well as a comparison with similar homes in the area
Home Values in the Area
Average Home Value in this Area
Purchase History
| Date | Buyer | Sale Price | Title Company |
|---|---|---|---|
| 514 Hutchens Llc | -- | -- | |
| Southern State Investments Llc | $135,000 | -- | |
| Hud & Housing Of Urban Development | -- | -- | |
| Washington Mutual Bank Fa | $86,092 | -- | |
| Turner Shiela | $79,720 | -- | |
| Rainey Edward L Gloria J | $47,000 | -- |
Source: Public Records
Mortgage History
| Date | Status | Borrower | Loan Amount |
|---|---|---|---|
| Previous Owner | Turner Shiela | $79,000 | |
| Previous Owner | Rainey Edward L Gloria J | $47,000 |
Source: Public Records
Tax History Compared to Growth
Tax History
| Year | Tax Paid | Tax Assessment Tax Assessment Total Assessment is a certain percentage of the fair market value that is determined by local assessors to be the total taxable value of land and additions on the property. | Land | Improvement |
|---|---|---|---|---|
| 2025 | $2,002 | $62,760 | $23,480 | $39,280 |
| 2023 | $2,598 | $62,760 | $23,480 | $39,280 |
| 2022 | $1,567 | $38,720 | $6,680 | $32,040 |
| 2021 | $1,144 | $28,240 | $6,000 | $22,240 |
| 2020 | $1,142 | $27,880 | $5,920 | $21,960 |
| 2019 | $490 | $27,440 | $5,840 | $21,600 |
| 2018 | $563 | $13,600 | $3,240 | $10,360 |
| 2017 | $542 | $12,560 | $3,320 | $9,240 |
| 2016 | $544 | $12,560 | $3,320 | $9,240 |
| 2015 | $1,032 | $12,560 | $3,320 | $9,240 |
| 2014 | $569 | $12,560 | $3,320 | $9,240 |
Source: Public Records
Map
Nearby Homes
- 500 Hutchens Rd SE
- 2996 Jonesboro Rd SE Unit D
- 2996 Jonesboro Rd SE Unit G
- 2996 Jonesboro Rd SE Unit J
- 592 Waynes Ct SE
- 629 Sandys Ln SE
- 494 Hancock Dr SE
- Wynbrooke Plan at Broadlands
- Clifton Plan at Broadlands
- 495 Hancock Dr SE
- 2953 Orchard Ln SE
- 793 River Gardens Dr
- 571 Hancock Dr SE
- 597 River Gardens Dr
- Waverly Plan at Reserve at South River Gardens
- Wynbrooke 4 Bedroom Plan at Reserve at South River Gardens
- Wynbrooke Brick Plan at Reserve at South River Gardens
- Abbot Plan at Reserve at South River Gardens
- Clifton Plan at Reserve at South River Gardens
- 3236 Jonesboro Rd SE
- 508 Hutchens Rd SE
- 520 Hutchens Rd SE
- 511 Hutchens Rd SE
- 494 Hutchens Rd SE
- 0 Hutchens Rd SE Unit 8497265
- 0 Hutchens Rd SE Unit 8331301
- 0 Hutchens Rd SE Unit 8226182
- 0 Hutchens Rd SE Unit 8213873
- 0 Hutchens Rd SE Unit 7576666
- 0 Hutchens Rd SE Unit 8697707
- 0 Hutchens Rd SE Unit 8656315
- 0 Hutchens Rd SE Unit 8643925
- 0 Hutchens Rd SE Unit 8546655
- 0 Hutchens Rd SE Unit 8503829
- 0 Hutchens Rd SE Unit 8427942
- 0 Hutchens Rd SE Unit 8409191
- 0 Hutchens Rd SE Unit 8152888
- 0 Hutchens Rd SE Unit 7607725
- 0 Hutchens Rd SE Unit 7501853
- 0 Hutchens Rd SE Unit 7330943