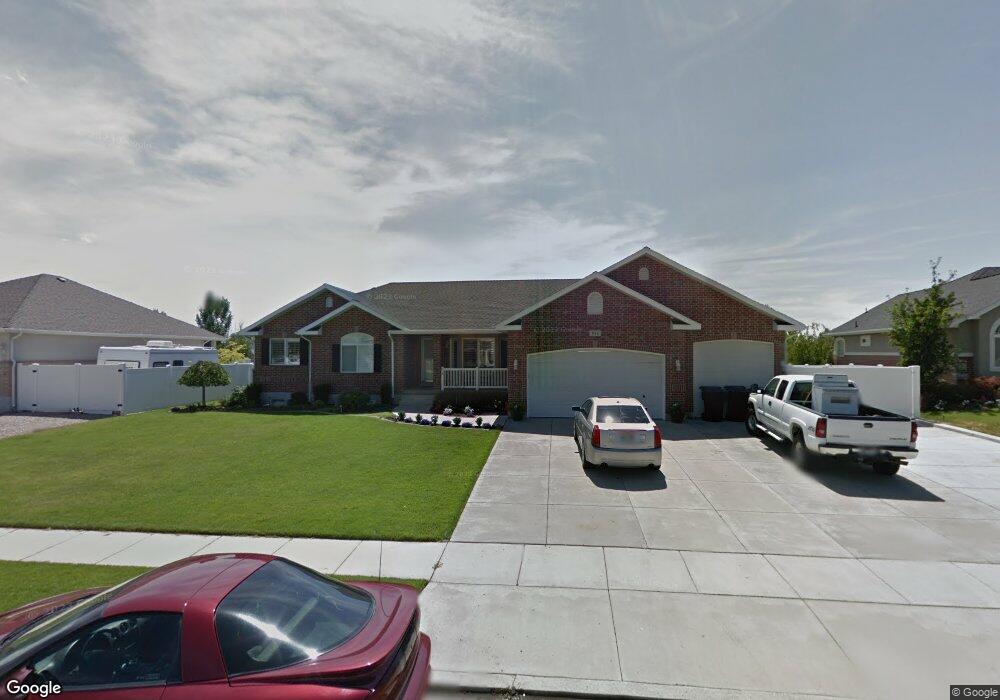
514 Joshua Dr Kaysville, UT 84037
West Kaysville NeighborhoodEstimated Value: $789,000 - $976,000
5
Beds
4
Baths
3,580
Sq Ft
$250/Sq Ft
Est. Value
About This Home
This home is located at 514 Joshua Dr, Kaysville, UT 84037 and is currently estimated at $894,586, approximately $249 per square foot. 514 Joshua Dr is a home located in Davis County with nearby schools including Kaysville Elementary School, Farmington High, and Centennial Junior High School.
Ownership History
Date
Name
Owned For
Owner Type
Purchase Details
Closed on
Jan 17, 2007
Sold by
Household Management Llc
Bought by
Tribe Heidi
Current Estimated Value
Purchase Details
Closed on
Sep 25, 2006
Sold by
Oram Clifton
Bought by
Household Management Llc
Purchase Details
Closed on
Jul 25, 2003
Sold by
Bennett Markham and Bennett Abby
Bought by
Oram Clifton
Home Financials for this Owner
Home Financials are based on the most recent Mortgage that was taken out on this home.
Original Mortgage
$252,000
Interest Rate
9.1%
Mortgage Type
Purchase Money Mortgage
Purchase Details
Closed on
Jun 23, 2000
Sold by
Lodder Homes Inc
Bought by
Bennett Markham and Bennett Abby
Home Financials for this Owner
Home Financials are based on the most recent Mortgage that was taken out on this home.
Original Mortgage
$206,800
Interest Rate
8.53%
Purchase Details
Closed on
Dec 15, 1999
Sold by
West Silo Ltd
Bought by
Lodder Homes Inc
Create a Home Valuation Report for This Property
The Home Valuation Report is an in-depth analysis detailing your home's value as well as a comparison with similar homes in the area
Home Values in the Area
Average Home Value in this Area
Purchase History
| Date | Buyer | Sale Price | Title Company |
|---|---|---|---|
| Tribe Heidi | -- | Bonneville Superior Title Co | |
| Household Management Llc | -- | Bonneville Superior Title Co | |
| Oram Clifton | -- | Home Abst & Title Co | |
| Bennett Markham | -- | First American Title Co | |
| Lodder Homes Inc | -- | First American Title Co |
Source: Public Records
Mortgage History
| Date | Status | Borrower | Loan Amount |
|---|---|---|---|
| Previous Owner | Oram Clifton | $252,000 | |
| Previous Owner | Bennett Markham | $206,800 |
Source: Public Records
Tax History Compared to Growth
Tax History
| Year | Tax Paid | Tax Assessment Tax Assessment Total Assessment is a certain percentage of the fair market value that is determined by local assessors to be the total taxable value of land and additions on the property. | Land | Improvement |
|---|---|---|---|---|
| 2025 | $4,277 | $444,400 | $236,144 | $208,256 |
| 2024 | $4,006 | $422,400 | $232,195 | $190,205 |
| 2023 | $3,974 | $742,000 | $401,547 | $340,453 |
| 2022 | $4,006 | $419,650 | $218,580 | $201,070 |
| 2021 | $3,688 | $579,000 | $269,910 | $309,090 |
| 2020 | $3,355 | $513,000 | $232,545 | $280,455 |
| 2019 | $3,410 | $512,000 | $225,313 | $286,687 |
| 2018 | $2,893 | $433,000 | $193,482 | $239,518 |
| 2016 | $2,563 | $201,685 | $93,253 | $108,432 |
| 2015 | $2,569 | $191,950 | $93,253 | $98,697 |
| 2014 | $2,537 | $192,944 | $70,343 | $122,601 |
| 2013 | -- | $164,563 | $52,962 | $111,601 |
Source: Public Records
Map
Nearby Homes
- 454 S Jay St W
- 52 S Grandison Ct E Unit 83-R
- 1346 W Blackbird Ln Unit 3
- 109 S Rock Loft Ridge Dr Unit 56-R
- 159 S Rock Loft Ridge Dr Unit 59-R
- 209 N Rock Loft Ridge E Unit 32-R
- 180 S Rock Loft Ridge Dr E Unit 7-R
- 246 N Rock Loft Ridge Dr Unit 36-R
- 22 S Rock Loft Ridge Dr Unit 16-R
- 34 S Rock Loft Ridge Dr Unit 85-R
- 190 N Rock Loft Ridge Dr Unit 40-R
- 75 S Grandison Ct E Unit 69-R
- 93 S Rock Loft Ridge Dr Unit 55-R
- 167 S Grandison E Unit 74-R
- 127 S Rock Loft Ridge Dr Unit 57-R
- 28 N Rock Loft Ridge Dr Unit 46-R
- 96 S Rock Loft Ridge Dr Unit 12-R
- 67 S Rock Loft Ridge Dr Unit 53-R
- 86 S Grandison Ct E Unit 79-R
- 198 S Rock Loft Ridge Dr E Unit 6-R