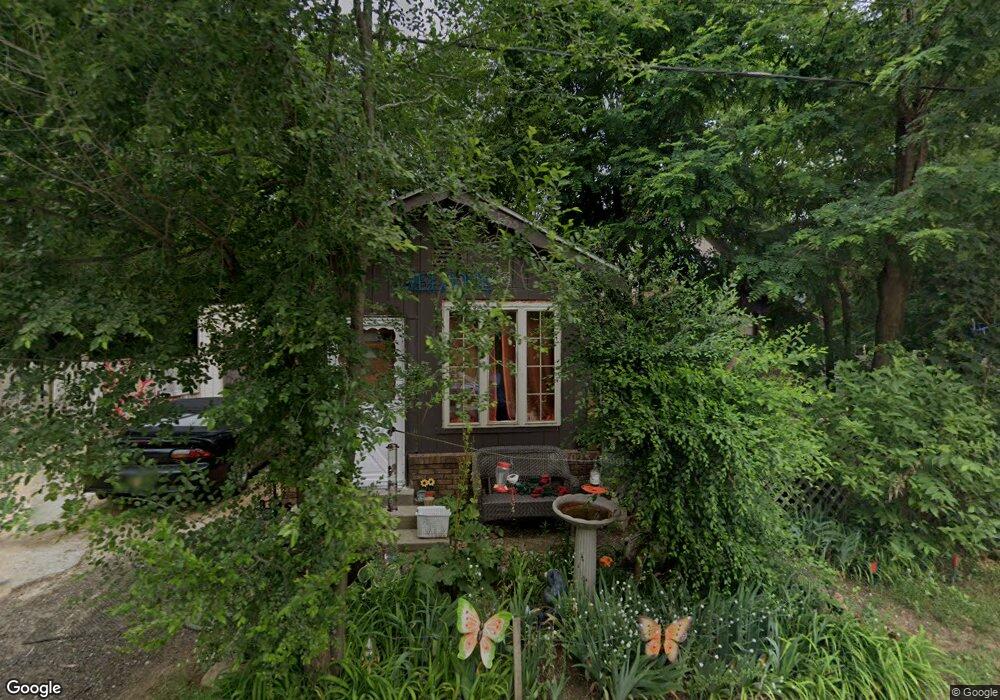
514 Maple St Allegan, MI 49010
Estimated Value: $160,308 - $203,000
3
Beds
1
Bath
1,310
Sq Ft
$145/Sq Ft
Est. Value
About This Home
This home is located at 514 Maple St, Allegan, MI 49010 and is currently estimated at $190,077, approximately $145 per square foot. 514 Maple St is a home located in Allegan County with nearby schools including West Ward Elementary School, L.E. White Middle School, and Allegan High School.
Ownership History
Date
Name
Owned For
Owner Type
Purchase Details
Closed on
Jun 3, 2009
Sold by
Rowe Ricky Dean
Bought by
Piwer Patricia Lynn
Current Estimated Value
Purchase Details
Closed on
Jan 18, 2007
Sold by
Hunter Tim and Hunter Laura
Bought by
Wells Fargo Bank Na
Purchase Details
Closed on
Jan 1, 2002
Sold by
Williams John M and Williams Dawn L
Bought by
Oon O Llc
Purchase Details
Closed on
Dec 16, 1994
Sold by
Ellington-Banks Cherise A
Bought by
"Horton
Create a Home Valuation Report for This Property
The Home Valuation Report is an in-depth analysis detailing your home's value as well as a comparison with similar homes in the area
Home Values in the Area
Average Home Value in this Area
Purchase History
| Date | Buyer | Sale Price | Title Company |
|---|---|---|---|
| Piwer Patricia Lynn | -- | None Available | |
| Wells Fargo Bank Na | $77,672 | None Available | |
| Oon O Llc | -- | -- | |
| "Horton | -- | -- |
Source: Public Records
Tax History Compared to Growth
Tax History
| Year | Tax Paid | Tax Assessment Tax Assessment Total Assessment is a certain percentage of the fair market value that is determined by local assessors to be the total taxable value of land and additions on the property. | Land | Improvement |
|---|---|---|---|---|
| 2025 | $1,123 | $51,100 | $12,700 | $38,400 |
| 2024 | $1,022 | $44,600 | $11,100 | $33,500 |
| 2023 | $1,059 | $38,000 | $10,500 | $27,500 |
| 2022 | $1,022 | $33,200 | $8,700 | $24,500 |
| 2021 | $2,248 | $31,100 | $6,900 | $24,200 |
| 2020 | $1,097 | $35,000 | $6,400 | $28,600 |
| 2019 | $939 | $34,100 | $6,100 | $28,000 |
| 2018 | $902 | $25,700 | $5,900 | $19,800 |
| 2017 | $0 | $24,000 | $5,000 | $19,000 |
| 2016 | $0 | $20,100 | $4,200 | $15,900 |
| 2015 | -- | $20,100 | $4,200 | $15,900 |
| 2014 | -- | $20,100 | $2,800 | $17,300 |
| 2013 | $1,282 | $22,000 | $2,800 | $19,200 |
Source: Public Records
Map
Nearby Homes