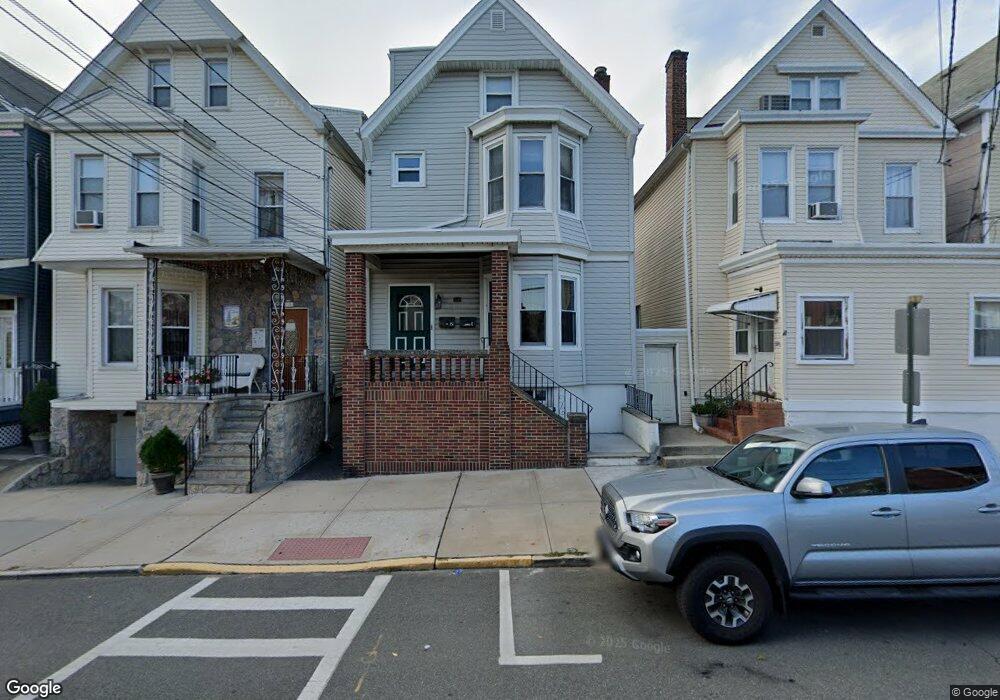
514 N 3rd St Unit 2 East Newark, NJ 07029
Estimated Value: $494,000 - $631,000
3
Beds
1
Bath
2,362
Sq Ft
$245/Sq Ft
Est. Value
About This Home
This home is located at 514 N 3rd St Unit 2, East Newark, NJ 07029 and is currently estimated at $579,304, approximately $245 per square foot. 514 N 3rd St Unit 2 is a home located in Hudson County with nearby schools including East Newark Public School, Kearny Christian Academy, and Marwah Academy.
Ownership History
Date
Name
Owned For
Owner Type
Purchase Details
Closed on
May 3, 2022
Sold by
Jorge Rodrigues-Cunha
Bought by
Hashmi Mehvish Iqbal
Current Estimated Value
Home Financials for this Owner
Home Financials are based on the most recent Mortgage that was taken out on this home.
Original Mortgage
$396,000
Outstanding Balance
$374,345
Interest Rate
4.72%
Mortgage Type
New Conventional
Estimated Equity
$204,959
Purchase Details
Closed on
Oct 22, 2014
Sold by
Delli Santi Fred P
Bought by
Rodrigues- Cunha Jorge
Home Financials for this Owner
Home Financials are based on the most recent Mortgage that was taken out on this home.
Original Mortgage
$274,725
Interest Rate
4.17%
Mortgage Type
FHA
Purchase Details
Closed on
Dec 3, 2002
Sold by
Dellisanti Fred and Dellisanti Marianna D
Bought by
Dellisanti Fred P
Create a Home Valuation Report for This Property
The Home Valuation Report is an in-depth analysis detailing your home's value as well as a comparison with similar homes in the area
Home Values in the Area
Average Home Value in this Area
Purchase History
| Date | Buyer | Sale Price | Title Company |
|---|---|---|---|
| Hashmi Mehvish Iqbal | $495,000 | Techno Title & Abstract | |
| Hashmi Mehvish Iqbal | $495,000 | Techno Title & Abstract | |
| Rodrigues- Cunha Jorge | $300,000 | Agent For Chicago Title Ins | |
| Dellisanti Fred P | -- | -- |
Source: Public Records
Mortgage History
| Date | Status | Borrower | Loan Amount |
|---|---|---|---|
| Open | Hashmi Mehvish Iqbal | $396,000 | |
| Closed | Hashmi Mehvish Iqbal | $396,000 | |
| Previous Owner | Rodrigues- Cunha Jorge | $274,725 |
Source: Public Records
Tax History Compared to Growth
Tax History
| Year | Tax Paid | Tax Assessment Tax Assessment Total Assessment is a certain percentage of the fair market value that is determined by local assessors to be the total taxable value of land and additions on the property. | Land | Improvement |
|---|---|---|---|---|
| 2025 | $7,973 | $269,100 | $62,500 | $206,600 |
| 2024 | $7,564 | $269,100 | $62,500 | $206,600 |
| 2023 | $7,564 | $269,100 | $62,500 | $206,600 |
| 2022 | $7,349 | $269,100 | $62,500 | $206,600 |
| 2021 | $7,311 | $269,100 | $62,500 | $206,600 |
| 2020 | $7,015 | $269,100 | $62,500 | $206,600 |
| 2019 | $7,018 | $269,100 | $62,500 | $206,600 |
| 2018 | $6,881 | $269,100 | $62,500 | $206,600 |
| 2017 | $7,052 | $278,300 | $62,500 | $215,800 |
| 2016 | $6,257 | $67,800 | $15,000 | $52,800 |
| 2015 | $6,145 | $67,800 | $15,000 | $52,800 |
| 2014 | $6,179 | $67,800 | $15,000 | $52,800 |
Source: Public Records
Map
Nearby Homes