NOT LISTED FOR SALE

514 N Maple St Ephrata, PA 17522

Estimated Value: $271,000 - $287,000

3 Beds
1 Bath
1,092 Sq Ft
$254/Sq Ft Est. Value

Last Sold November 25, 2013

Last sale price $139,900 $128 Per Sq Ft

Est. 98% increase in value since last sale

Current estimated payment $1,708/month

About This Home

As of November 2013

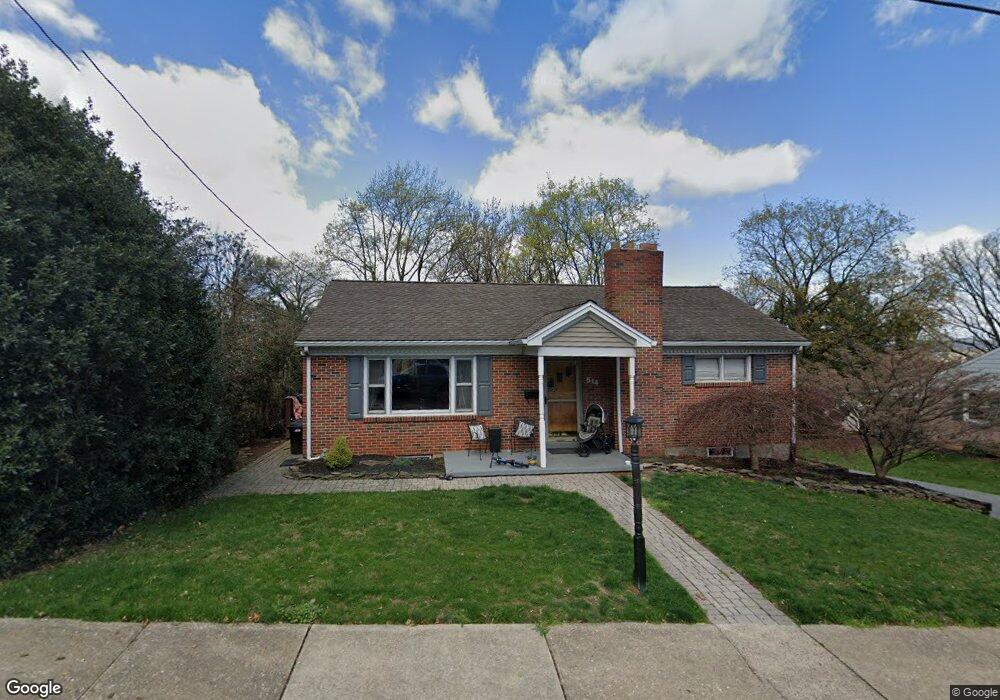
Beautiful brick rancher with nice tile bath, and big deck in nice private yard. Tenant occupied

Ownership History

Date Name Owned For Owner Type

Purchase Details

Listed on
May 1, 2013
Closed on
Nov 22, 2013
Sold by
Williamson Kevin E
Bought by
Depasqua Andrew and Tonzola Amy
Buyer's Agent
MICHAEL VAVRECK
United Real Estate Strive 212
List Price
$149,900
Sold Price
$139,900
Premium/Discount to List
-$10,000
-6.67%
Current Estimated Value
$277,185

Home Financials for this Owner

Home Financials are based on the most recent Mortgage that was taken out on this home.
Estimated Appreciation
$137,285
Avg. Annual Appreciation
5.90%
Original Mortgage
$142,755
Outstanding Balance
$106,712
Interest Rate
4.29%
Mortgage Type
New Conventional
Estimated Equity
$170,473

Purchase Details

Closed on
Aug 21, 2006
Sold by
Williamson Kevin E and Williamson Tricia M
Bought by
Williamson Kevin E

Purchase Details

Closed on
Oct 25, 2002
Sold by
Williamson Kevin E
Bought by
Williamson Kevin E and Williamson Tricia M
Source: Public Records

Range of Values:

Collateral Analytics

Collateral Analytics Collateral Analytics AVMs (Automated Valuation Model) employ a number of statistical approaches combined with neighborhood-specific comparable selection guarantees the most up-to-date and precise valuations.

Not Available

Collateral Analytics does not have data for the current month. Please view the chart for historical values.

ICE

ICE Mortgage Technology ICE Mortgage Technology’s AVM (Automated Valuation Model) is a state-of-the-art online residential property valuation tool that provides a quick and accurate estimate of the value of almost any home in the U.S.

Not Available

ICE Mortgage Technology does not have data for the current month. Please view the chart for historical values.

First American

First American First American Data & Analytics’ next-generation AVM combines unrivaled data assets with a blended ensemble of valuation models to produce highly accurate, reliable valuations you can trust.

Not Available

First American does not have data for the current month. Please view the chart for historical values.

Quantarium

Quantarium Quantarium’s valuation service, repeatedly proven the industry’s most accurate and comprehensive, is supercharged with a self-learning and auto-tuning AI engine that continually becomes smarter and more accurate as it processes daily inputs from the industry’s leading RE data lake.

Not Available

Quantarium does not have data for the current month. Please view the chart for historical values.

Average Value
Not Available
List Price
Sold Price
Create a Home Valuation Report for This Property
The Home Valuation Report is an in-depth analysis detailing your home's value as well as a comparison with similar homes in the area

Home Values in the Area

Source: Public Records

Average Home Value in this Area


Source: Public Records

Purchase History

Date Buyer Sale Price Title Company
Depasqua Andrew $139,900 None Available
Williamson Kevin E -- None Available
Williamson Kevin E -- --
Source: Public Records

Mortgage History

Date Status Borrower Loan Amount
Open Depasqua Andrew $142,755
Source: Public Records

Property History

Date Event Price List to Sale Price per Sq Ft Prior Sale
11/25/2013 11/25/13 Sold $139,900 -6.7% $128 / Sq Ft View Prior Sale
07/15/2013 07/15/13 Pending -- -- --
05/01/2013 05/01/13 For Sale $149,900 -- $137 / Sq Ft

Tax History Compared to Growth

Source: Public Records

Tax History

Year Tax Paid Tax Assessment Tax Assessment Total Assessment is a certain percentage of the fair market value that is determined by local assessors to be the total taxable value of land and additions on the property. Land Improvement
2025 $3,048 $127,100 $38,500 $88,600
2024 $3,048 $127,100 $38,500 $88,600
2023 $2,973 $127,100 $38,500 $88,600
2022 $2,846 $127,100 $38,500 $88,600
2021 $2,786 $127,100 $38,500 $88,600
2020 $2,786 $127,100 $38,500 $88,600
2019 $2,748 $127,100 $38,500 $88,600
2018 $3,258 $127,100 $38,500 $88,600
2017 $3,014 $113,900 $36,100 $77,800
2016 $2,990 $113,900 $36,100 $77,800
2015 $661 $113,900 $36,100 $77,800
2014 $2,232 $113,900 $36,100 $77,800
Source: Public Records

Agents Affiliated with this Home

  • Section Image
See All Agents

Map