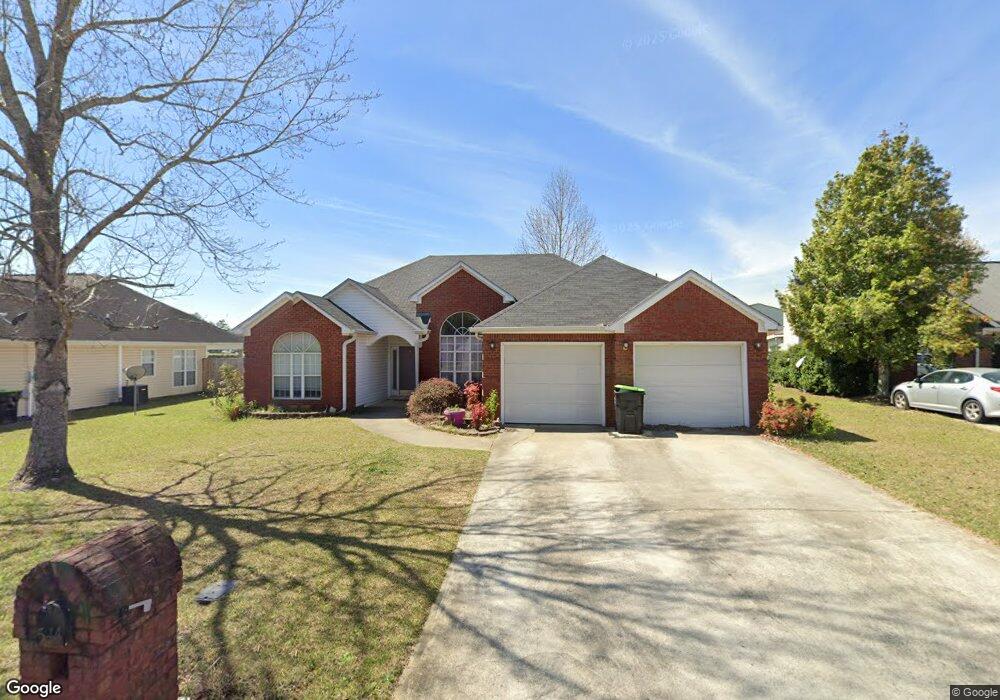
514 Pebblebrook W Warner Robins, GA 31088
Estimated Value: $211,000 - $251,113
3
Beds
3
Baths
1,597
Sq Ft
$145/Sq Ft
Est. Value
About This Home
This home is located at 514 Pebblebrook W, Warner Robins, GA 31088 and is currently estimated at $232,028, approximately $145 per square foot. 514 Pebblebrook W is a home located in Houston County with nearby schools including Russell Elementary School, Huntington Middle School, and Warner Robins High School.
Ownership History
Date
Name
Owned For
Owner Type
Purchase Details
Closed on
Feb 26, 2007
Sold by
Hemsworth Kristin P
Bought by
Kerr Kristin Priscilla and Kerr Matthew B
Current Estimated Value
Purchase Details
Closed on
Mar 7, 2006
Sold by
Holland Christopher C and Holland Christy R
Bought by
Hemsworth Kristin P
Home Financials for this Owner
Home Financials are based on the most recent Mortgage that was taken out on this home.
Original Mortgage
$123,932
Outstanding Balance
$70,289
Interest Rate
6.23%
Mortgage Type
FHA
Estimated Equity
$161,739
Purchase Details
Closed on
Jul 26, 2001
Sold by
Sims Nita N
Bought by
Holland Christopher C and Holland Christy R
Purchase Details
Closed on
Jan 17, 1997
Sold by
Swan Homes Inc
Bought by
Sims Nita N
Purchase Details
Closed on
Apr 9, 1996
Sold by
Georgia-Houston Properties Inc
Bought by
Swan Homes Inc
Purchase Details
Closed on
Jun 30, 1994
Sold by
Schwanebeck William L
Bought by
Georgia-Houston Properties Inc
Create a Home Valuation Report for This Property
The Home Valuation Report is an in-depth analysis detailing your home's value as well as a comparison with similar homes in the area
Home Values in the Area
Average Home Value in this Area
Purchase History
| Date | Buyer | Sale Price | Title Company |
|---|---|---|---|
| Kerr Kristin Priscilla | -- | None Available | |
| Hemsworth Kristin P | $130,000 | None Available | |
| Holland Christopher C | $125,900 | -- | |
| Sims Nita N | $105,000 | -- | |
| Swan Homes Inc | $15,000 | -- | |
| Georgia-Houston Properties Inc | -- | -- |
Source: Public Records
Mortgage History
| Date | Status | Borrower | Loan Amount |
|---|---|---|---|
| Open | Hemsworth Kristin P | $123,932 |
Source: Public Records
Tax History
| Year | Tax Paid | Tax Assessment Tax Assessment Total Assessment is a certain percentage of the fair market value that is determined by local assessors to be the total taxable value of land and additions on the property. | Land | Improvement |
|---|---|---|---|---|
| 2024 | $2,310 | $70,600 | $6,400 | $64,200 |
| 2023 | $1,915 | $58,080 | $6,400 | $51,680 |
| 2022 | $1,207 | $52,480 | $6,400 | $46,080 |
| 2021 | $1,104 | $47,760 | $6,400 | $41,360 |
| 2020 | $1,099 | $47,320 | $6,400 | $40,920 |
| 2019 | $1,099 | $47,320 | $6,400 | $40,920 |
| 2018 | $1,099 | $47,320 | $6,400 | $40,920 |
| 2017 | $1,100 | $47,320 | $6,400 | $40,920 |
| 2016 | $1,102 | $47,320 | $6,400 | $40,920 |
| 2015 | -- | $47,320 | $6,400 | $40,920 |
| 2014 | -- | $47,320 | $6,400 | $40,920 |
| 2013 | -- | $47,800 | $6,400 | $41,400 |
Source: Public Records
Map
Nearby Homes
- 111 Raintree Dr
- LOT 25 & 26 Plantation Dr
- 207 Summer Hill Place
- 314 Air View Dr
- 422 Lake Front Dr
- 105 Leisure Lake Ct
- 103 Leisure Lake Ct
- 209 Lake Front Dr
- 101 Leisure Lake Ct
- 401 Sandy Run Rd
- 107 Pheasant Cove
- 301 Lake Front Dr
- 0 Shadow Ln Unit 260583
- 101 S Oaks Ln
- 102 Tallulah Trail
- 103 Shenandoah Trail
- 330 Hidden Creek Cir
- 220 Station Way
- 122 Tallulah Trail
- 217 Station Way
- 516 Pebblebrook W
- 512 Pebblebrook W
- 518 Pebblebrook W
- 507 Pebblebrook W
- 505 Pebblebrook W
- 510 Pebblebrook W
- 509 Pebblebrook W
- 520 Pebblebrook W
- 511 Pebblebrook W
- 503 Pebblebrook W
- 508 Pebblebrook W
- 513 Pebblebrook W
- 522 Pebblebrook W
- 205 Cross Creek Way
- 203 Cross Creek Way
- 207 Cross Creek Way
- 501 Pebblebrook W
- 515 Pebblebrook W
- 504 Pebblebrook W
- 209 Cross Creek Way
Your Personal Tour Guide
Ask me questions while you tour the home.