514 Riverside Ave Newport Beach, CA 92663
Newport Heights NeighborhoodEstimated Value: $2,017,000 - $3,385,000
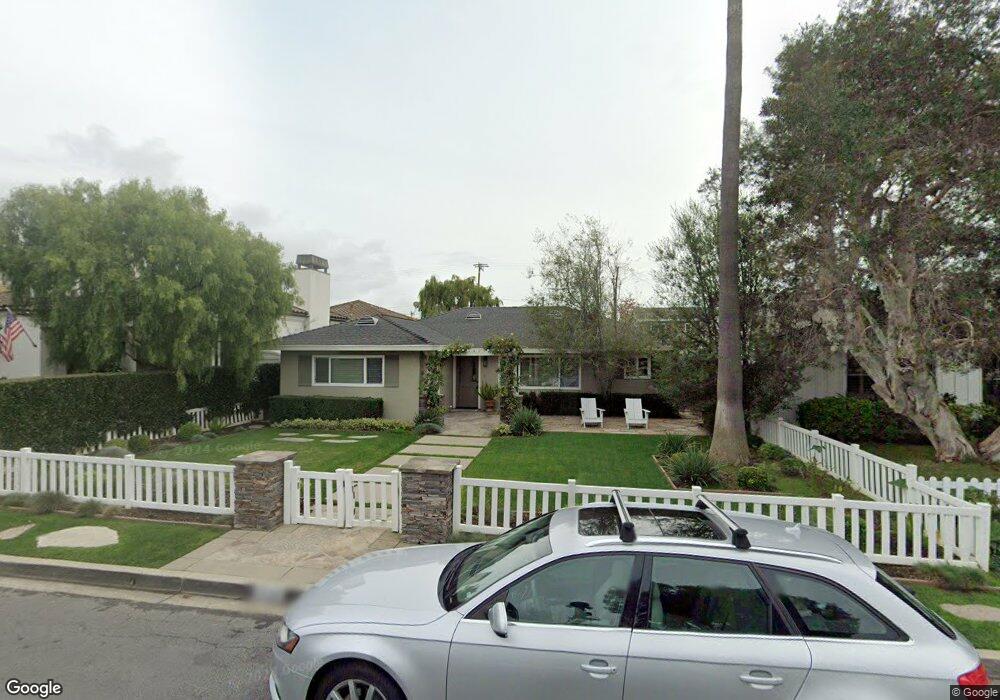
About This Home
This home is located at 514 Riverside Ave, Newport Beach, CA 92663 and is currently estimated at $2,850,775, approximately $1,897 per square foot. 514 Riverside Ave is a home located in Orange County with nearby schools including Newport Heights Elementary, Horace Ensign Intermediate School, and Newport Harbor High School.
Ownership History
We collect this data history from publicly available records. To have your information removed, we recommend requesting removal directly through your county’s website.
Purchase Details
Home Financials for this Owner
Home Financials are based on the most recent Mortgage that was taken out on this home.Purchase Details
Home Financials for this Owner
Home Financials are based on the most recent Mortgage that was taken out on this home.Purchase Details
Home Financials for this Owner
Home Financials are based on the most recent Mortgage that was taken out on this home.Purchase Details
Home Financials for this Owner
Home Financials are based on the most recent Mortgage that was taken out on this home.Purchase Details
Purchase Details
Purchase Details
Home Financials for this Owner
Home Financials are based on the most recent Mortgage that was taken out on this home.Purchase Details
Home Values in the Area
Average Home Value in this Area
Purchase History
We collect this data history from publicly available records. To have your information removed, we recommend requesting removal directly through your county’s website.
| Date | Buyer | Sale Price | Title Company |
|---|---|---|---|
| -- | California Best Title | ||
| -- | California Best Title | ||
| -- | California Best Title | ||
| -- | California Best Title | ||
| -- | California Best Title | ||
| -- | California Best Title | ||
| -- | Equity Title Company | ||
| -- | None Listed On Document | ||
| -- | None Available | ||
| -- | Fat | ||
| -- | Landamerica-Southland | ||
| -- | Equity Title Company | ||
| $910,000 | Equity Title Company | ||
| -- | Chicago Title Co | ||
| -- | Chicago Title Co | ||
| $630,000 | Chicago Title Co | ||
| -- | -- |
Mortgage History
We collect this data history from publicly available records. To have your information removed, we recommend requesting removal directly through your county’s website.
| Date | Status | Borrower | Loan Amount |
|---|---|---|---|
| Open | $703,000 | ||
| Previous Owner | $704,750 | ||
| Previous Owner | $708,250 | ||
| Previous Owner | $600,000 | ||
| Previous Owner | $798,000 | ||
| Previous Owner | $673,000 | ||
| Previous Owner | $685,000 | ||
| Previous Owner | $630,000 |
Tax History
We collect this data history from publicly available records. To have your information removed, we recommend requesting removal directly through your county’s website.
| Year | Tax Paid | Tax Assessment Tax Assessment Total Assessment is a certain percentage of the fair market value that is determined by local assessors to be the total taxable value of land and additions on the property. | Land | Improvement |
|---|---|---|---|---|
| 2025 | $14,660 | $1,345,766 | $1,211,007 | $134,759 |
| 2024 | $14,245 | $1,309,312 | $1,187,262 | $122,050 |
| 2023 | $13,343 | $1,243,586 | $1,163,982 | $79,604 |
| 2022 | $13,118 | $1,219,202 | $1,141,158 | $78,044 |
| 2021 | $12,867 | $1,195,297 | $1,118,783 | $76,514 |
| 2020 | $12,742 | $1,183,041 | $1,107,311 | $75,730 |
| 2019 | $12,480 | $1,159,845 | $1,085,599 | $74,246 |
| 2018 | $12,232 | $1,137,103 | $1,064,312 | $72,791 |
| 2017 | $12,015 | $1,114,807 | $1,043,443 | $71,364 |
| 2016 | $11,745 | $1,092,949 | $1,022,984 | $69,965 |
| 2015 | $11,632 | $1,076,532 | $1,007,617 | $68,915 |
| 2014 | $11,357 | $1,055,445 | $987,879 | $67,566 |
Map
- 515 Tustin Ave
- 2700 Cliff Dr
- 501 Aliso Ave
- 2401 Clay St
- 255 Ocean View Ave
- 416 Aliso Ave
- 1578 Redlands Place
- 230 Ocean View Ave
- 1594 Redlands Place
- 419 Irvine Ave
- 2001 Haven Place
- 1603 Sea Horse Cir
- 2101 E 15th St
- 2304 Cliff Dr
- 1805 Clay St
- 2325 E 16th St
- 3222 Clay St
- 2212 Cliff Dr
- 3209 Clay St
- 3214 Broad St Unit 2
- 522 Riverside Ave
- 518 Riverside Ave
- 534 Riverside Ave
- 530 Riverside Ave
- 523 Tustin Ave
- 510 Riverside Ave
- 527 Tustin Ave
- 519 Tustin Ave
- 531 Tustin Ave
- 523 Riverside Ave
- 521 Riverside Ave
- 519 Riverside Ave
- 527 Riverside Ave
- 538 Riverside Ave
- 535 Tustin Ave
- 511 Tustin Ave
- 515 Riverside Ave
- 531 Riverside Ave
- 2620 Clay St
- 500 Riverside Ave
Ask me questions while you tour the home.