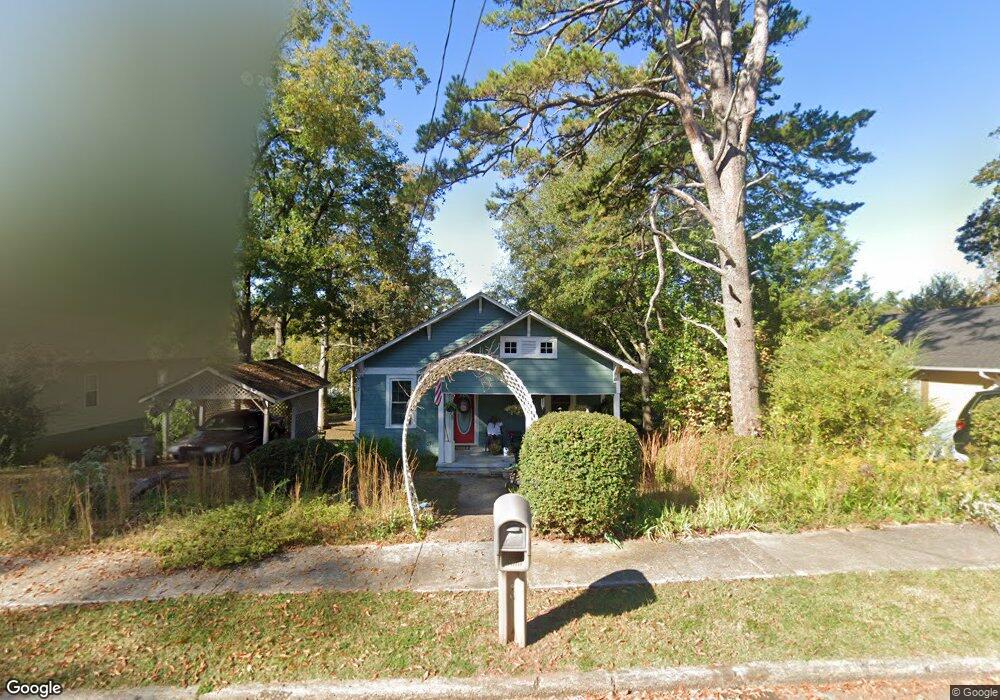
514 S Lee St Lagrange, GA 30240
Estimated Value: $139,680 - $168,000
3
Beds
1
Bath
1,400
Sq Ft
$107/Sq Ft
Est. Value
About This Home
This home is located at 514 S Lee St, Lagrange, GA 30240 and is currently estimated at $149,170, approximately $106 per square foot. 514 S Lee St is a home located in Troup County with nearby schools including Ethel W. Kight Elementary School, Hollis Hand Elementary School, and Franklin Forest Elementary School.
Ownership History
Date
Name
Owned For
Owner Type
Purchase Details
Closed on
May 2, 2005
Sold by
Dash For Lagrange Inc
Bought by
Tucker Irma Jean
Current Estimated Value
Home Financials for this Owner
Home Financials are based on the most recent Mortgage that was taken out on this home.
Original Mortgage
$41,925
Outstanding Balance
$21,631
Interest Rate
5.98%
Mortgage Type
New Conventional
Estimated Equity
$127,539
Purchase Details
Closed on
Jan 9, 2004
Sold by
K & R Properties Inc
Bought by
Dash For Lagrange Inc
Purchase Details
Closed on
Feb 23, 1998
Sold by
Clifton Clifton and Clifton Cofield
Bought by
K & R Properties Inc
Purchase Details
Closed on
May 30, 1997
Sold by
Ozella Adams Rice
Bought by
Clifton Clifton and Clifton Cofield
Purchase Details
Closed on
Jan 18, 1996
Sold by
Rice G H
Bought by
Ozella Adams Rice
Purchase Details
Closed on
Jul 17, 1986
Sold by
Gordon Henry B
Bought by
Rice G H
Purchase Details
Closed on
Aug 1, 1952
Sold by
Callaway Community Fdn
Bought by
Gordon Henry B
Create a Home Valuation Report for This Property
The Home Valuation Report is an in-depth analysis detailing your home's value as well as a comparison with similar homes in the area
Purchase History
| Date | Buyer | Sale Price | Title Company |
|---|---|---|---|
| Tucker Irma Jean | $68,000 | -- | |
| Dash For Lagrange Inc | $180,000 | -- | |
| K & R Properties Inc | -- | -- | |
| Clifton Clifton | $40,000 | -- | |
| Ozella Adams Rice | -- | -- | |
| Rice G H | $15,000 | -- | |
| Gordon Henry B | -- | -- |
Source: Public Records
Mortgage History
| Date | Status | Borrower | Loan Amount |
|---|---|---|---|
| Open | Tucker Irma Jean | $41,925 |
Source: Public Records
Tax History
| Year | Tax Paid | Tax Assessment Tax Assessment Total Assessment is a certain percentage of the fair market value that is determined by local assessors to be the total taxable value of land and additions on the property. | Land | Improvement |
|---|---|---|---|---|
| 2025 | $602 | $56,840 | $3,840 | $53,000 |
| 2024 | $317 | $40,680 | $3,840 | $36,840 |
| 2023 | $136 | $23,600 | $3,840 | $19,760 |
| 2022 | $200 | $28,840 | $3,840 | $25,000 |
| 2021 | $690 | $24,880 | $3,840 | $21,040 |
| 2020 | $690 | $24,880 | $3,840 | $21,040 |
| 2019 | $620 | $22,560 | $3,840 | $18,720 |
| 2018 | $618 | $22,470 | $3,750 | $18,720 |
| 2017 | $618 | $22,470 | $3,750 | $18,720 |
| 2016 | $599 | $21,848 | $3,750 | $18,098 |
| 2015 | $603 | $21,938 | $3,840 | $18,098 |
| 2014 | $575 | $20,986 | $3,840 | $17,146 |
| 2013 | -- | $24,309 | $3,864 | $20,445 |
Source: Public Records
Map
Nearby Homes
- 202 Parker Ln
- 507 S Lee St
- 109 Garfield St
- 211 Moores Hill
- 0 Moores Hill
- 1520 Brownwood Ave
- 0 N Lee St Unit 10550825
- 217 Jefferson St
- 812 Elm St
- 102 Crown St Unit LOT 1
- 101 Crown St Unit LOT 5
- 1304 Forrest Ave
- 1405 Forrest Ave
- 1402 Forrest Ave
- 600 Park Ave
- 1015 Stonewall St
- 1017 Stonewall St
- 421 College Ave
- 416 Park Ave
- 403 College Ave
Your Personal Tour Guide
Ask me questions while you tour the home.