Estimated payment $2,469/month
Highlights
- RV or Boat Parking
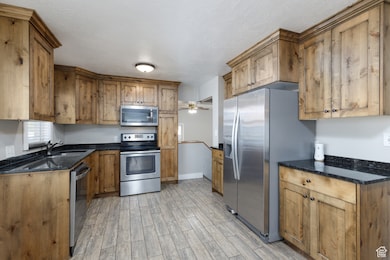
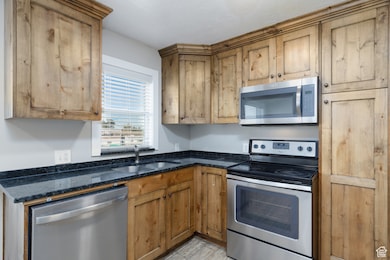
- Updated Kitchen
- Mountain View
- Solar Power System
- Mature Trees
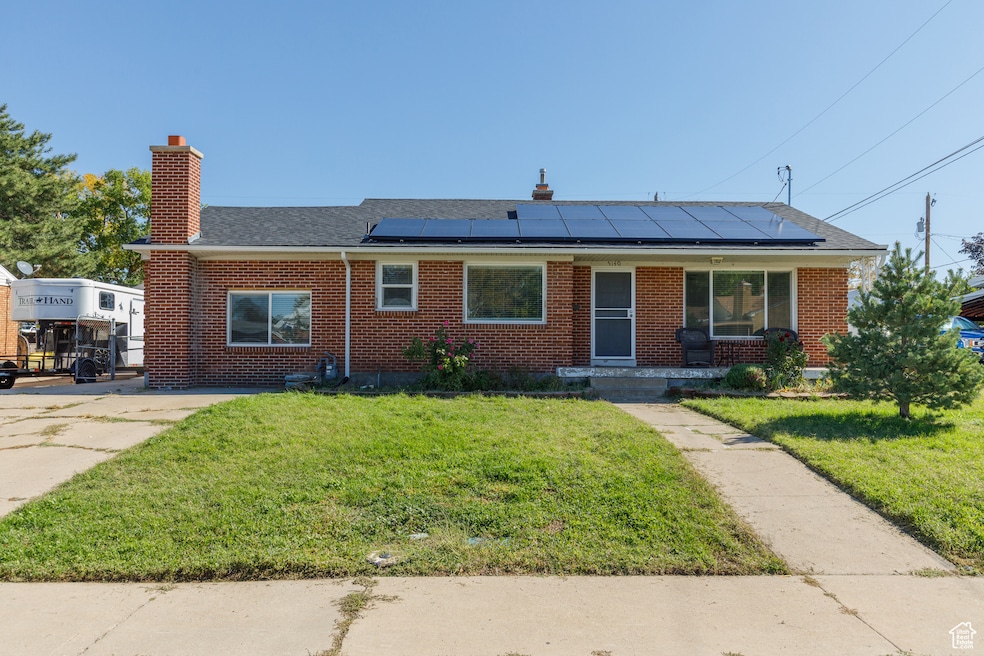
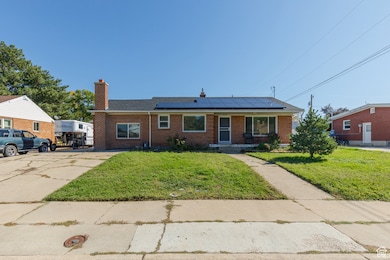
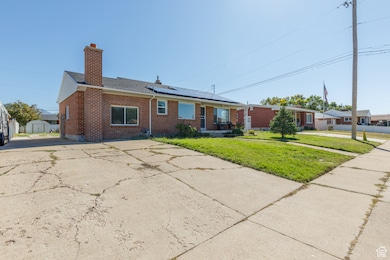
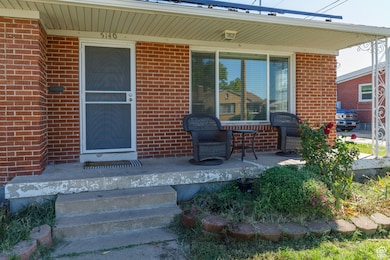
- Rambler Architecture
About This Home
Don't miss your chance-schedule your private showing today! This incredible Roy home has it all! West-facing for shady evenings in the backyard and ideally located near schools, parks, shopping, and quick I-15 access. Step inside to a beautifully updated kitchen.. Enjoy peace of mind with a newer air conditioning system, furnace, and brand-new automatic sprinklers. Newer Solar panels. The fully fenced yard is perfect for kids, pets, and backyard gatherings. With two spacious family rooms-including one featuring a cozy wood-burning stove on a classic brick hearth-you'll have all the space you need to relax or entertain. This one won't last long-come see it before it's gone!
Listing Agent
ERA Brokers Consolidated (Ogden) License #6085746 Listed on: 10/08/2025
Home Details
Home Type
- Single Family
Est. Annual Taxes
- $2,168
Year Built
- Built in 1951
Lot Details
- 10,019 Sq Ft Lot
- Property is Fully Fenced
- Landscaped
- Mature Trees
- Property is zoned Single-Family
Home Design
- Rambler Architecture
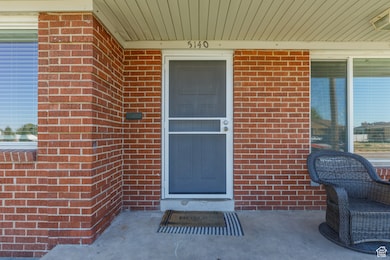
- Brick Exterior Construction
Interior Spaces
- 2,265 Sq Ft Home
- 2-Story Property
- 1 Fireplace
- Blinds
- Mountain Views
- Basement Fills Entire Space Under The House
Kitchen
- Updated Kitchen
- Granite Countertops
- Disposal
Flooring
- Carpet
- Tile
Bedrooms and Bathrooms
- 4 Bedrooms | 2 Main Level Bedrooms
Parking
- 4 Parking Spaces
- 4 Open Parking Spaces
- RV or Boat Parking
Eco-Friendly Details
- Solar Power System
- Solar owned by seller
- Reclaimed Water Irrigation System
Schools
- Lakeview Elementary School
- Roy Middle School
- Roy High School
Utilities
- Forced Air Heating and Cooling System
- Natural Gas Connected
Community Details
- No Home Owners Association
Listing and Financial Details
- Assessor Parcel Number 09-007-0033
Map
Home Values in the Area
Average Home Value in this Area
Tax History
| Year | Tax Paid | Tax Assessment Tax Assessment Total Assessment is a certain percentage of the fair market value that is determined by local assessors to be the total taxable value of land and additions on the property. | Land | Improvement |
|---|---|---|---|---|
| 2025 | $2,275 | $353,317 | $122,630 | $230,687 |
| 2024 | $2,168 | $338,000 | $122,631 | $215,369 |
| 2023 | $2,162 | $339,000 | $116,799 | $222,201 |
| 2022 | $2,436 | $399,000 | $106,623 | $292,377 |
| 2021 | $1,865 | $273,000 | $71,154 | $201,846 |
| 2020 | $1,782 | $240,000 | $71,154 | $168,846 |
| 2019 | $1,685 | $213,000 | $40,998 | $172,002 |
| 2018 | $1,519 | $179,000 | $37,911 | $141,089 |
| 2017 | $1,427 | $157,000 | $37,911 | $119,089 |
| 2016 | $1,325 | $77,889 | $19,302 | $58,587 |
| 2015 | $1,046 | $74,019 | $19,302 | $54,717 |
| 2014 | $1,058 | $74,019 | $16,433 | $57,586 |
Property History
| Date | Event | Price | List to Sale | Price per Sq Ft |
|---|---|---|---|---|
| 10/08/2025 10/08/25 | For Sale | $435,000 | -- | $192 / Sq Ft |
Purchase History
| Date | Type | Sale Price | Title Company |
|---|---|---|---|
| Warranty Deed | -- | Backman Title Services Ltd | |
| Warranty Deed | -- | Mountain View Title | |
| Warranty Deed | -- | Associated Title |
Mortgage History
| Date | Status | Loan Amount | Loan Type |
|---|---|---|---|
| Open | $226,100 | No Value Available | |
| Previous Owner | $119,928 | No Value Available | |
| Previous Owner | $99,622 | FHA |
Source: UtahRealEstate.com
MLS Number: 2116381
APN: 09-007-0033
Disclaimer: Certain information contained herein is derived from information provided by parties other than Homes.com. All information provided is deemed reliable, but is not guaranteed to be accurate and should be independently verified.
![]() IDX information is provided exclusively for consumers’ personal, non-commercial use, that it may not be used for any purpose other than to identify prospective properties consumers may be interested in purchasing, and that the data is deemed reliable but is not guaranteed accurate by the MLS. Licensor is only providing the MLS Content and not other sources of data provided in the Product.
IDX information is provided exclusively for consumers’ personal, non-commercial use, that it may not be used for any purpose other than to identify prospective properties consumers may be interested in purchasing, and that the data is deemed reliable but is not guaranteed accurate by the MLS. Licensor is only providing the MLS Content and not other sources of data provided in the Product.
Based on information from the Wasatch Front Regional Multiple Listing Service, Inc.. All data, including all measurements and calculations of area, is obtained from various sources and has not been, and will not be, verified by broker or the MLS. All information should be independently reviewed and verified for accuracy. Properties may or may not be listed by the office/agent presenting the information.
- 5185 S 2100 W
- 5140 S 2175 W
- 5243 S 2200 W
- 5315 S 1950 W
- 2179 W 4975 S
- 5261 S 2200 W
- 2266 W 5100 S
- 5342 S 2200 W
- 1789 W 5050 S
- 1777 W 5050 S
- 2153 W 4800 S
- 2184 W 5500 S
- 5006 S 1800 W
- 1789 W 5000 S
- 1765 W 5000 S
- 2067 W 4750 S
- 5345 S 2425 W
- 5545 S 2100 W Unit 12
- 5545 S 2100 W Unit 20
- 5545 S 2100 W Unit D22
- 5000 S 1900 W
- 1934 W 4700 S Unit 1
- 1551 W Riverdale Rd
- 1801 W 4650 S
- 2575 W 4800 S
- 4539 S 1800 W
- 5239 S 2700 W
- 4536 S 1900 W Unit 12
- 4499 S 1930 W
- 2619 W 4650 S
- 2225 W 4350 S
- 4621 S W Pk Dr
- 2285 W 5950 S Unit Basement
- 4389 S Locomotive Dr
- 4419 S 2750 W
- 3024 W 4450 S
- 2602 W 4050 S
- 4177 S 1000 W
- 1991 W 550 N
- 2405 Hinckley Dr
