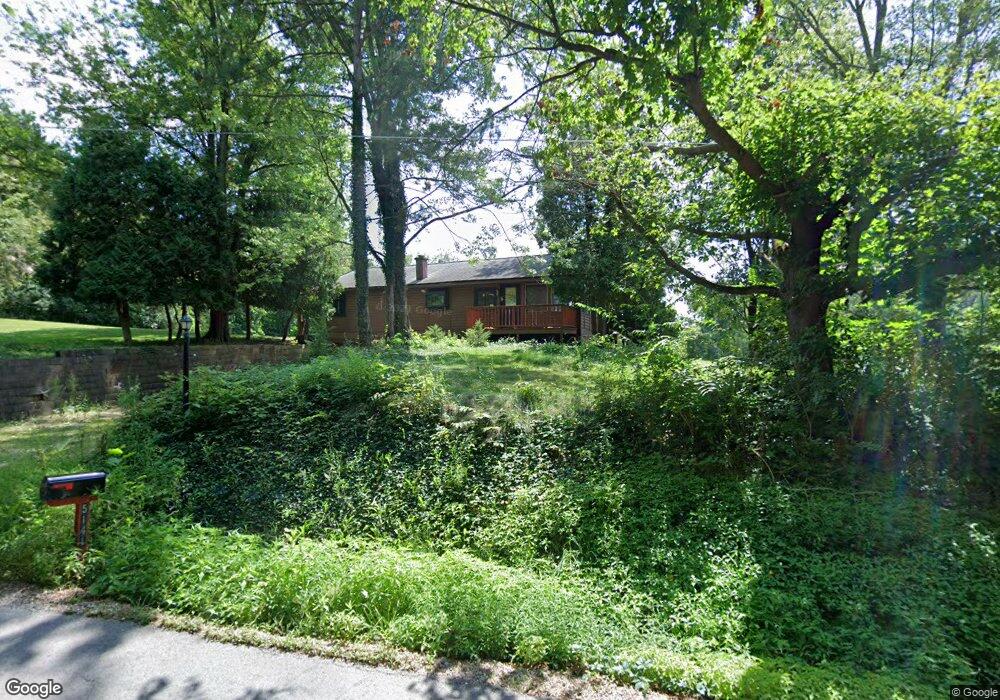
5141 Clark Shaw Rd Powell, OH 43065
Concord NeighborhoodEstimated Value: $426,000 - $561,000
2
Beds
1
Bath
1,600
Sq Ft
$300/Sq Ft
Est. Value
About This Home
This home is located at 5141 Clark Shaw Rd, Powell, OH 43065 and is currently estimated at $479,915, approximately $299 per square foot. 5141 Clark Shaw Rd is a home located in Delaware County with nearby schools including Buckeye Valley High School and The Emilia School.
Ownership History
Date
Name
Owned For
Owner Type
Purchase Details
Closed on
Aug 5, 2005
Sold by
Wilcox Franklin E and Wilcox Margaret B
Bought by
Pun Ming Hong Jim
Current Estimated Value
Home Financials for this Owner
Home Financials are based on the most recent Mortgage that was taken out on this home.
Original Mortgage
$200,000
Interest Rate
5.26%
Mortgage Type
Fannie Mae Freddie Mac
Purchase Details
Closed on
May 31, 2000
Sold by
Bryant Deborah J
Bought by
Wilcox Franklin E and Wilcox Margaret B
Home Financials for this Owner
Home Financials are based on the most recent Mortgage that was taken out on this home.
Original Mortgage
$147,250
Interest Rate
8.18%
Mortgage Type
New Conventional
Purchase Details
Closed on
May 19, 2000
Sold by
Trst Dennis C Erwin
Bought by
Bryant Deborah J
Home Financials for this Owner
Home Financials are based on the most recent Mortgage that was taken out on this home.
Original Mortgage
$147,250
Interest Rate
8.18%
Mortgage Type
New Conventional
Create a Home Valuation Report for This Property
The Home Valuation Report is an in-depth analysis detailing your home's value as well as a comparison with similar homes in the area
Home Values in the Area
Average Home Value in this Area
Purchase History
| Date | Buyer | Sale Price | Title Company |
|---|---|---|---|
| Pun Ming Hong Jim | $265,000 | -- | |
| Wilcox Franklin E | $155,000 | -- | |
| Bryant Deborah J | $142,000 | -- |
Source: Public Records
Mortgage History
| Date | Status | Borrower | Loan Amount |
|---|---|---|---|
| Closed | Pun Ming Hong Jim | $200,000 | |
| Previous Owner | Wilcox Franklin E | $147,250 |
Source: Public Records
Tax History Compared to Growth
Tax History
| Year | Tax Paid | Tax Assessment Tax Assessment Total Assessment is a certain percentage of the fair market value that is determined by local assessors to be the total taxable value of land and additions on the property. | Land | Improvement |
|---|---|---|---|---|
| 2024 | $3,879 | $111,730 | $67,450 | $44,280 |
| 2023 | $3,875 | $111,730 | $67,450 | $44,280 |
| 2022 | $2,825 | $73,440 | $51,350 | $22,090 |
| 2021 | $2,826 | $73,440 | $51,350 | $22,090 |
| 2020 | $2,844 | $73,440 | $51,350 | $22,090 |
| 2019 | $2,737 | $64,750 | $44,660 | $20,090 |
| 2018 | $2,780 | $64,750 | $44,660 | $20,090 |
| 2017 | $2,629 | $63,010 | $34,900 | $28,110 |
| 2016 | $2,536 | $63,010 | $34,900 | $28,110 |
| 2015 | $2,671 | $63,010 | $34,900 | $28,110 |
| 2014 | $2,518 | $63,010 | $34,900 | $28,110 |
| 2013 | $2,606 | $63,010 | $34,900 | $28,110 |
Source: Public Records
Map
Nearby Homes
- 5701 Dublin Rd
- 5310 S Section Line Rd
- 5229 Bean Oller Rd
- 5968 S Section Line Rd
- 0 S Section Line Rd Unit Tract 6 225024549
- 0 S Section Line Rd Unit Tract 5 225024546
- 0 S Section Line Rd Unit Tract 4B 225024545
- 0 S Section Line Rd Unit Tract 4A 225024542
- 0 S Section Line Rd Unit Tract 3 225024539
- 0 S Section Line Rd Unit Tract 2B 225024538
- 0 S Section Line Rd Unit Tract 2A 225024534
- 0 S Section Line Rd Unit Tract 1 225024531
- 6299 S Section Line Rd
- 4161 Clark Shaw Rd
- The Iris Residence Plan at Reserve at Scioto Bluff
- Scarlett Custom Plan A at Reserve at Scioto Bluff
- Kline Residence Plan at Reserve at Scioto Bluff
- Ferryman Residence Plan at Reserve at Scioto Bluff
- Ashford Plan at Reserve at Scioto Bluff
- Sawyer Plan at Reserve at Scioto Bluff
- 5095 Clark Shaw Rd
- 5110 Clark Shaw Rd
- 5085 Clark Shaw Rd
- 5080 Clark-Shaw Rd
- 5080 Clark Shaw Rd
- 5619 Riverside Dr
- 5559 Riverside Dr
- 5553 Riverside Dr
- 5015 Clark Shaw Rd
- 5050 Clark Shaw Rd
- 5000 Clark Shaw Rd
- 5541 Riverside Dr
- 5541 Riverside Dr Unit O
- 5547 Riverside Dr
- 5046 Clark Shaw Rd
- 5042 Clark Shaw Rd
- 5505 Riverside Dr
- 5038 Clark Shaw Rd
- 4901 Clark Shaw Rd
- 5538 S Section Line Rd