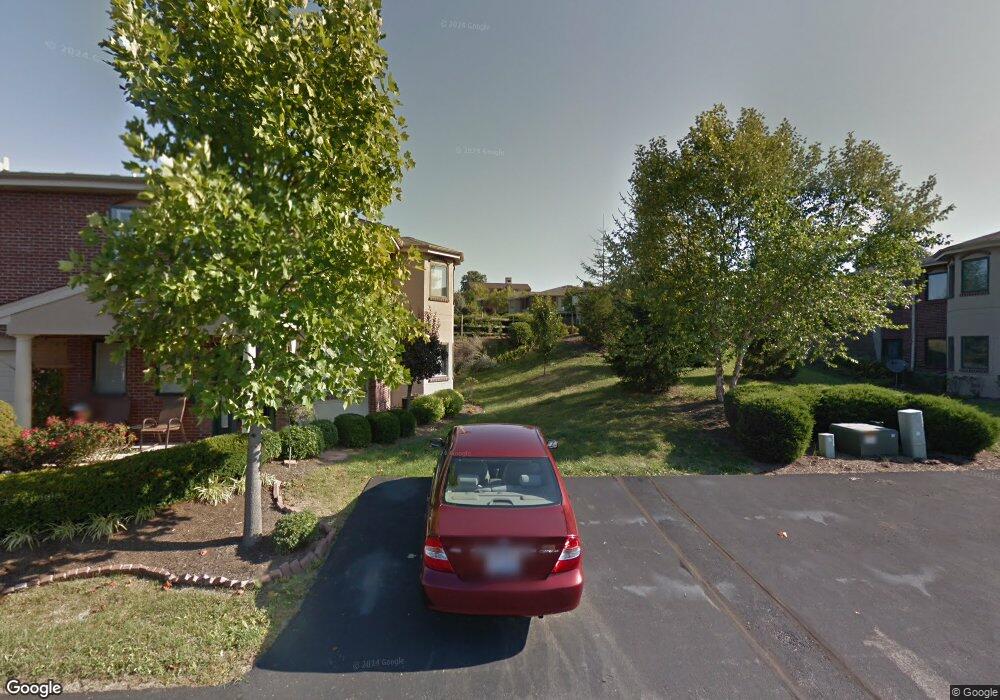
5141 Northbend Crossing Unit 117 Cincinnati, OH 45247
West Monfort Heights NeighborhoodEstimated Value: $205,695 - $217,000
2
Beds
2
Baths
1,252
Sq Ft
$170/Sq Ft
Est. Value
About This Home
This home is located at 5141 Northbend Crossing Unit 117, Cincinnati, OH 45247 and is currently estimated at $213,174, approximately $170 per square foot. 5141 Northbend Crossing Unit 117 is a home located in Hamilton County with nearby schools including Monfort Heights Elementary School, White Oak Middle School, and Colerain High School.
Ownership History
Date
Name
Owned For
Owner Type
Purchase Details
Closed on
Sep 29, 2017
Sold by
Willen Thomas B
Bought by
King Greg J and King Deborah L
Current Estimated Value
Home Financials for this Owner
Home Financials are based on the most recent Mortgage that was taken out on this home.
Original Mortgage
$113,905
Outstanding Balance
$95,143
Interest Rate
3.82%
Mortgage Type
New Conventional
Estimated Equity
$118,031
Purchase Details
Closed on
May 9, 2007
Sold by
Johnson Cheryl A
Bought by
Willen Pearl E
Purchase Details
Closed on
Aug 15, 2006
Sold by
Johnson Cheryl A
Bought by
Johnson Cheryl A and The Cheryl A Johnson Revocable Trust
Purchase Details
Closed on
Sep 17, 2004
Sold by
Jung Steven R
Bought by
Johnson Cheryl A and Donovan Dorine E
Purchase Details
Closed on
May 29, 2004
Sold by
Jung Robert C and Jung Patricia J
Bought by
Jung Steven R
Purchase Details
Closed on
May 22, 2003
Sold by
S/Nbl Associates
Bought by
Jung Robert C and Jung Patricia J
Create a Home Valuation Report for This Property
The Home Valuation Report is an in-depth analysis detailing your home's value as well as a comparison with similar homes in the area
Home Values in the Area
Average Home Value in this Area
Purchase History
| Date | Buyer | Sale Price | Title Company |
|---|---|---|---|
| King Greg J | $119,900 | Chicago Title Company Llc | |
| Willen Pearl E | $153,000 | First Title Agency Inc | |
| Johnson Cheryl A | -- | None Available | |
| Johnson Cheryl A | $152,500 | Vintage Title Agency Inc | |
| Jung Steven R | -- | -- | |
| Jung Robert C | $143,500 | Advanced Land Title Agency L |
Source: Public Records
Mortgage History
| Date | Status | Borrower | Loan Amount |
|---|---|---|---|
| Open | King Greg J | $113,905 |
Source: Public Records
Tax History Compared to Growth
Tax History
| Year | Tax Paid | Tax Assessment Tax Assessment Total Assessment is a certain percentage of the fair market value that is determined by local assessors to be the total taxable value of land and additions on the property. | Land | Improvement |
|---|---|---|---|---|
| 2024 | $3,145 | $59,364 | $10,325 | $49,039 |
| 2023 | $3,160 | $59,364 | $10,325 | $49,039 |
| 2022 | $2,735 | $41,966 | $8,012 | $33,954 |
| 2021 | $2,507 | $41,966 | $8,012 | $33,954 |
| 2020 | $2,532 | $41,966 | $8,012 | $33,954 |
| 2019 | $2,473 | $37,128 | $7,350 | $29,778 |
| 2018 | $2,202 | $37,128 | $7,350 | $29,778 |
| 2017 | $2,182 | $37,128 | $7,350 | $29,778 |
| 2016 | $2,224 | $36,877 | $6,395 | $30,482 |
| 2015 | $2,213 | $36,877 | $6,395 | $30,482 |
| 2014 | $2,221 | $36,877 | $6,395 | $30,482 |
| 2013 | $2,392 | $42,385 | $7,350 | $35,035 |
Source: Public Records
Map
Nearby Homes
- 5440 Asbury Lake Dr
- 3775 Boomer Rd
- 5476 Audro Dr
- 4491 W Fork Rd
- 4201 Boomer Rd
- 3731 Ridgedale Dr
- 5538 Silverpoint Dr
- The McPherson Plan at Ivy Rose - Designer Collection
- Carrington Plan at Ivy Rose - Designer Collection
- Winston Plan at Ivy Rose - Designer Collection
- Calvin Plan at Ivy Rose - Designer Collection
- Miles Plan at Ivy Rose - Designer Collection
- Blair Plan at Ivy Rose - Designer Collection
- Magnolia Plan at Ivy Rose - Designer Collection
- Grandin Plan at Ivy Rose - Designer Collection
- Wyatt Plan at Ivy Rose - Designer Collection
- Avery Plan at Ivy Rose - Designer Collection
- Charles Plan at Ivy Rose - Designer Collection
- 4575 Boomer Rd
- 4628 Boomer Rd
- 5173 N Bend Crossing
- 5145 N Bend Crossing
- 5175 Northbend Crossing Unit 113
- 5143 Northbend Crossing Unit 116
- 5143 N Bend Rd
- 5173 N Bend Crossing Unit 11-2
- 5141 N Bend Crossing
- 5177 Northbend Crossing
- 5173 Northbend Crossing Unit 112
- 5175 N Bend Crossing
- 5145 Northbend Crossing Unit 115
- 5171 Northbend Crossing Unit 111
- 5171 N Bend Crossing Unit 11
- 5177 Northbend Crossing Unit 114
- 5103 N Bend Crossing
- 5167 Northbend Crossing Unit 104
- 5151 Northbend Crossing Unit 107
- 5151 N Bend Crossing
- 5103 Northbend Crossing Unit 143
- 5123 Northbend Crossing Unit 142