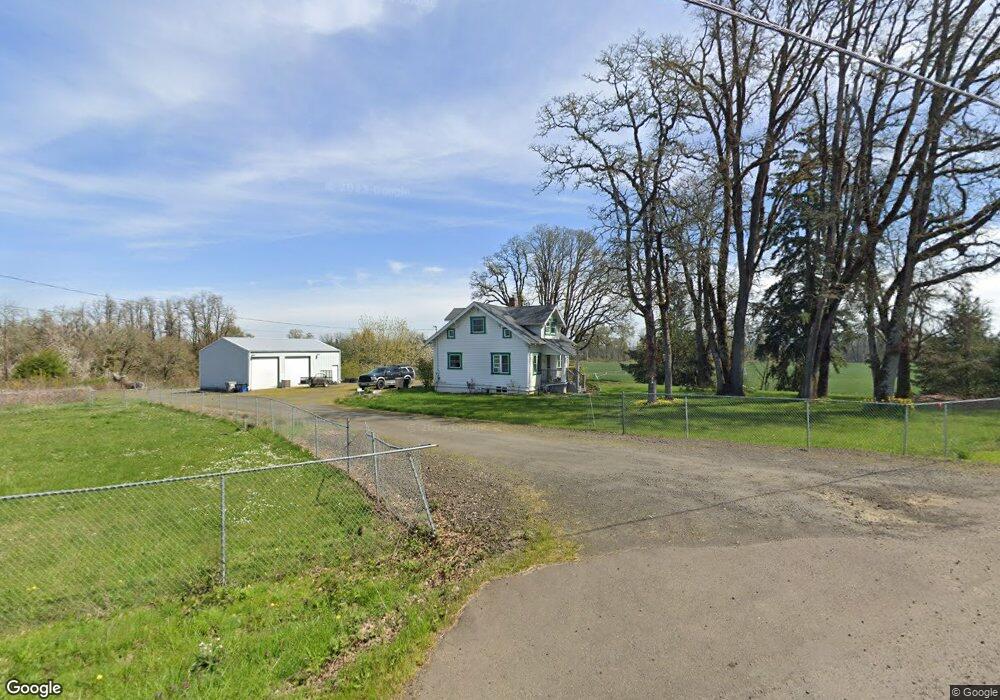
5141 Springhill Dr NE Albany, OR 97321
Estimated Value: $922,000 - $1,311,000
3
Beds
2
Baths
1,152
Sq Ft
$924/Sq Ft
Est. Value
About This Home
This home is located at 5141 Springhill Dr NE, Albany, OR 97321 and is currently estimated at $1,064,086, approximately $923 per square foot. 5141 Springhill Dr NE is a home located in Benton County with nearby schools including Fir Grove Primary School, Oak Grove Intermediate School, and North Albany Middle School.
Ownership History
Date
Name
Owned For
Owner Type
Purchase Details
Closed on
Aug 12, 2019
Sold by
Alberti Barbara A and Alberti Salvatore V
Bought by
R B Webber Development Llc
Current Estimated Value
Home Financials for this Owner
Home Financials are based on the most recent Mortgage that was taken out on this home.
Original Mortgage
$600,000
Interest Rate
3.7%
Mortgage Type
Commercial
Purchase Details
Closed on
Feb 19, 2013
Sold by
Alberti Salvatore V and Alberti Barbara A
Bought by
Vann Beckner John Taylor
Purchase Details
Closed on
May 18, 2007
Sold by
Glassey Stanley E and Glassey Marion V
Bought by
Alberti Salvatore and Alberti Barbara A
Purchase Details
Closed on
Mar 28, 2003
Sold by
Glassey Stanley E
Bought by
Schrock Marcus
Home Financials for this Owner
Home Financials are based on the most recent Mortgage that was taken out on this home.
Original Mortgage
$250,000
Interest Rate
5.79%
Mortgage Type
Seller Take Back
Create a Home Valuation Report for This Property
The Home Valuation Report is an in-depth analysis detailing your home's value as well as a comparison with similar homes in the area
Home Values in the Area
Average Home Value in this Area
Purchase History
| Date | Buyer | Sale Price | Title Company |
|---|---|---|---|
| R B Webber Development Llc | $800,000 | Ticor Title | |
| Vann Beckner John Taylor | -- | None Available | |
| Alberti Salvatore | $667,500 | First American Title | |
| Glassey Stanley E | -- | First American Title | |
| Schrock Marcus | $350,000 | First American Title |
Source: Public Records
Mortgage History
| Date | Status | Borrower | Loan Amount |
|---|---|---|---|
| Closed | R B Webber Development Llc | $600,000 | |
| Previous Owner | Schrock Marcus | $250,000 |
Source: Public Records
Tax History Compared to Growth
Tax History
| Year | Tax Paid | Tax Assessment Tax Assessment Total Assessment is a certain percentage of the fair market value that is determined by local assessors to be the total taxable value of land and additions on the property. | Land | Improvement |
|---|---|---|---|---|
| 2024 | $2,430 | $172,613 | -- | -- |
| 2023 | $2,292 | $167,698 | $0 | $0 |
| 2022 | $2,270 | $162,978 | $0 | $0 |
| 2021 | $2,133 | $158,358 | $0 | $0 |
| 2020 | $2,166 | $153,883 | $0 | $0 |
| 2019 | $1,980 | $149,497 | $0 | $0 |
| 2018 | $1,994 | $145,258 | $0 | $0 |
| 2017 | $1,926 | $141,145 | $0 | $0 |
| 2016 | $1,750 | $137,151 | $0 | $0 |
| 2015 | $1,729 | $133,273 | $0 | $0 |
| 2014 | $1,683 | $129,506 | $0 | $0 |
Source: Public Records
Map
Nearby Homes
- 4135 NW Alder Ave
- 3714 NW Wishram Dr
- 0 Powers (Lot 3) Ave NW Unit 825003
- 4266 NW Palestine Ave
- 2700 NW Miller Ln
- 3503 NW Valley View Dr
- 0 NW Unit 12199) Ln 824951
- 3 NW Powers Ave
- 0 Valley View (Lot 1102) NW Unit 827701
- 0 Valley View Dr NW Unit 1102
- 0 Valley View Dr NW Unit 1101 636500940
- 0 Valley View (Lot 1101) NW Unit 827700
- 2826 NW Sunny Ln
- 0 NW Arlington Dr Unit 459093609
- 2697 Broadway St NW
- 0 Arlington (Ta# 012488) Dr NW Unit 828948
- 2641 Crocker Ln NW
- 2643 NW Brianna St
- 2558 NW White Oak Ave
- 3212 NW Terrace Dr
- 5166 NW Springhill Dr
- 5168 Springhill Dr NW
- 2641 NW Linnview Ln
- 5170 Springhill Dr NW
- 5210 NW Springhill Dr
- 5221 Springhill Dr NE
- 5130 NW Springhill Dr
- 5573 NW Winn Dr
- 5098 Springhill Dr NW
- 2600 NW Linnview Ln
- 5239 Springhill Dr NE
- 5557 NW Winn Dr
- 5242 NW Springhill Dr
- 5172 Springhill Dr NW
- 5514 NW Winn Dr
- 5435 NW Winn Dr
- 5059 NW Picadilly Cir
- 5063 NW Picadilly Cir
- 5076 NW Springhill Dr
- 5063 Picadilly Cl NW