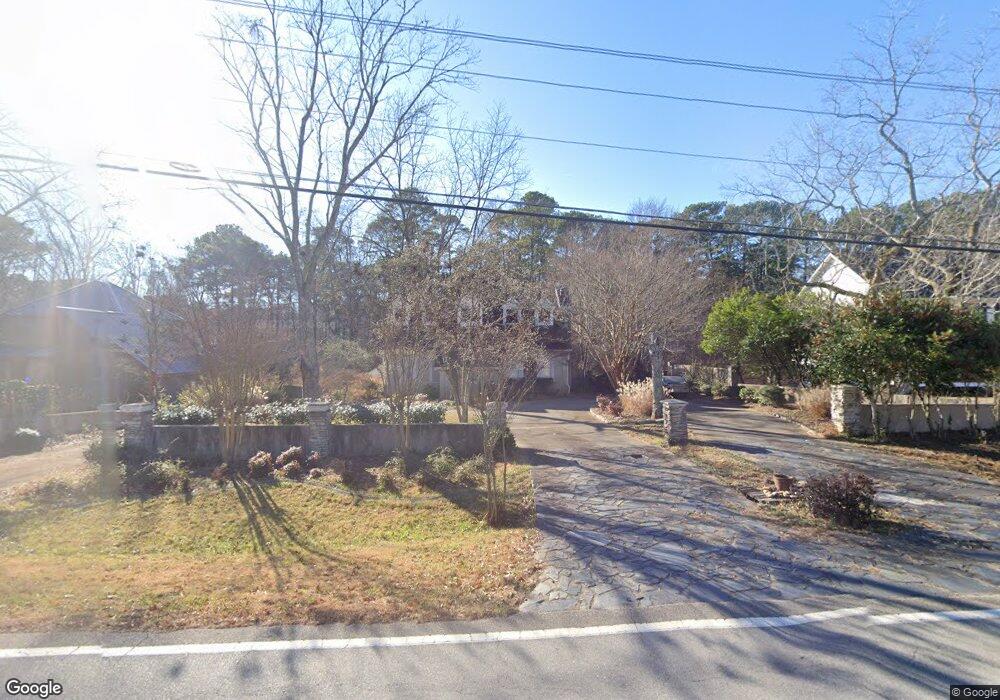
5141 W Jones Bridge Rd Unit 2 Norcross, GA 30092
Estimated Value: $611,000 - $685,000
4
Beds
3
Baths
3,171
Sq Ft
$205/Sq Ft
Est. Value
About This Home
This home is located at 5141 W Jones Bridge Rd Unit 2, Norcross, GA 30092 and is currently estimated at $648,735, approximately $204 per square foot. 5141 W Jones Bridge Rd Unit 2 is a home located in Gwinnett County with nearby schools including Simpson Elementary School, Pinckneyville Middle School, and Norcross High School.
Ownership History
Date
Name
Owned For
Owner Type
Purchase Details
Closed on
Aug 5, 2011
Sold by
Bbr Properties Llc
Bought by
Tewodros Amanuel A
Current Estimated Value
Home Financials for this Owner
Home Financials are based on the most recent Mortgage that was taken out on this home.
Original Mortgage
$181,771
Outstanding Balance
$124,542
Interest Rate
4.5%
Mortgage Type
FHA
Estimated Equity
$524,193
Purchase Details
Closed on
Oct 13, 2007
Sold by
Bbr Properties Llc
Bought by
Almonacid Jonathan P
Purchase Details
Closed on
Jan 29, 2007
Sold by
Corado Beverly F
Bought by
Bbr Properties Llc
Purchase Details
Closed on
Feb 2, 2001
Sold by
Nunez Josefina
Bought by
Tower Alicia
Purchase Details
Closed on
Jan 30, 1995
Sold by
Salehi Mohammad
Bought by
Nunez Jose Fina
Home Financials for this Owner
Home Financials are based on the most recent Mortgage that was taken out on this home.
Original Mortgage
$108,585
Interest Rate
10%
Mortgage Type
VA
Create a Home Valuation Report for This Property
The Home Valuation Report is an in-depth analysis detailing your home's value as well as a comparison with similar homes in the area
Home Values in the Area
Average Home Value in this Area
Purchase History
| Date | Buyer | Sale Price | Title Company |
|---|---|---|---|
| Tewodros Amanuel A | $186,500 | -- | |
| Almonacid Jonathan P | -- | -- | |
| Bbr Properties Llc | $10,000 | -- | |
| Tower Alicia | -- | -- | |
| Nunez Jose Fina | $5,000 | -- |
Source: Public Records
Mortgage History
| Date | Status | Borrower | Loan Amount |
|---|---|---|---|
| Open | Tewodros Amanuel A | $181,771 | |
| Previous Owner | Nunez Jose Fina | $108,585 |
Source: Public Records
Tax History Compared to Growth
Tax History
| Year | Tax Paid | Tax Assessment Tax Assessment Total Assessment is a certain percentage of the fair market value that is determined by local assessors to be the total taxable value of land and additions on the property. | Land | Improvement |
|---|---|---|---|---|
| 2025 | $5,517 | $185,560 | $31,920 | $153,640 |
| 2024 | $5,967 | $200,560 | $40,000 | $160,560 |
| 2023 | $5,967 | $188,680 | $36,400 | $152,280 |
| 2022 | $5,220 | $164,040 | $32,800 | $131,240 |
| 2021 | $4,983 | $147,960 | $26,240 | $121,720 |
| 2020 | $4,915 | $143,360 | $26,000 | $117,360 |
| 2019 | $4,761 | $143,360 | $26,000 | $117,360 |
| 2018 | $4,430 | $127,400 | $24,000 | $103,400 |
| 2016 | $3,750 | $100,000 | $24,000 | $76,000 |
| 2015 | $3,795 | $100,000 | $24,000 | $76,000 |
| 2014 | $3,565 | $96,760 | $24,000 | $72,760 |
Source: Public Records
Map
Nearby Homes
- 5397 Valley Mist Ct
- 5221 W Jones Bridge Rd
- 5354 Fox Hill Dr
- 5350 Wickershire Dr
- 4531 Outer Bank Dr
- 5465 Fort Fisher Way
- 5465 Fort Fisher Way
- 5545 Fitzpatrick Terrace
- 4916 Sudbrook Way Unit 253
- The Adams Plan at Waterside - Condos
- 4457 Watervale Way Unit 292
- 4477 Watervale Way Unit 286
- 5047 Shirley Oaks Dr Unit 313
- 4903 Sudbrook Way Unit 239
- The Olmstead II Plan at Waterside - Plaza
- The Stanley Plan at Waterside - Single Family
- The Stafford Plan at Waterside - Single Family
- 5039 Shirley Oaks Dr Unit 315
- 4479 Watervale Way Unit 285
- 5059 Shirley Oaks Dr Unit 309
- 5131 W Jones Bridge Rd Unit 2
- 5131 W Jones Bridge Rd
- 5151 W Jones Bridge Rd
- 5387 Valley Mist Ct Unit 3
- 5121 W Jones Bridge Rd
- 5377 Valley Mist Ct Unit 3
- 0 Valley Mist Ct Unit 7621969
- 4456 Wood Forest Dr
- 4446 Wood Forest Dr
- 4466 Wood Forest Dr
- 5111 W Jones Bridge Rd Unit 1
- 5369 Broadwood Ave
- 4476 Wood Forest Dr
- 5376 Valley Mist Ct
- 5359 Broadwood Ave
- 4486 Wood Forest Dr
- 5396 Valley Mist Ct
- 5386 Valley Mist Ct
- 0 Wood Forest Dr Unit 8577811
- 0 Wood Forest Dr Unit 8149803