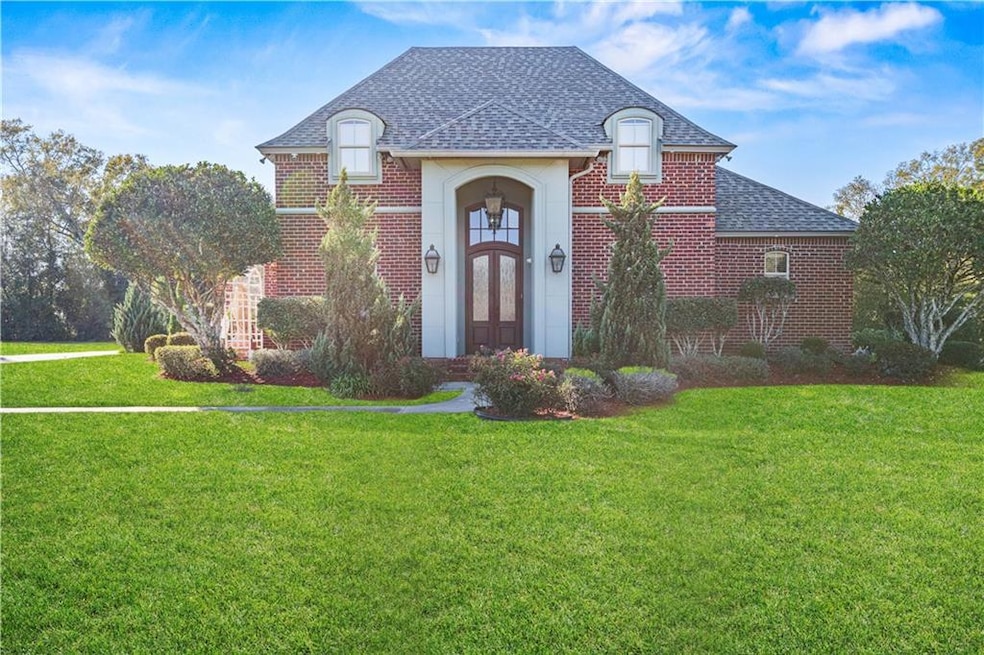
51439 Allen Dr Loranger, LA 70446
Estimated payment $3,497/month
Highlights
- In Ground Pool
- Granite Countertops
- Stainless Steel Appliances
- Acadian Style Architecture
- Double Oven
- Oversized Lot
About This Home
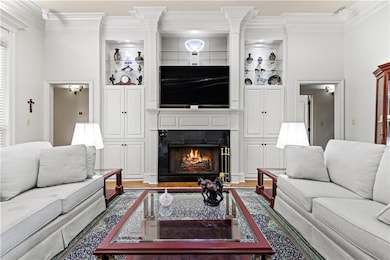
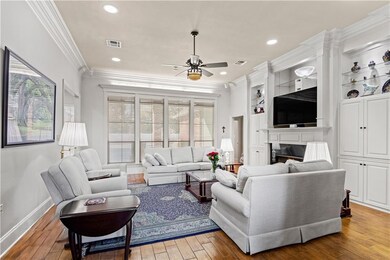
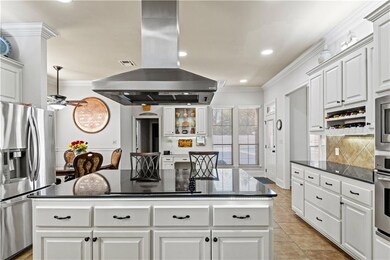
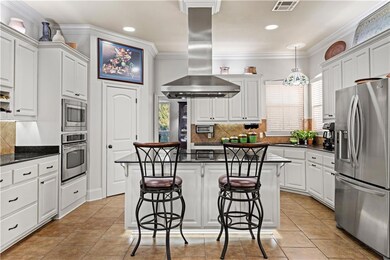
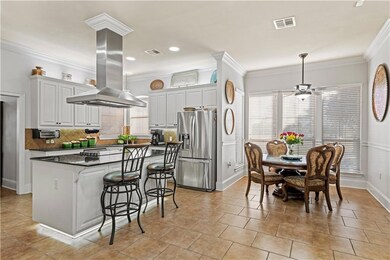
Welcome to your private retreat! This spacious brick home is nestled on 4.22 beautifully maintained acres, offering peace, privacy, and plenty of space to enjoy indoors & out. Home features a generous floor plan w/ multiple living areas, crown molding & LED lighting throughout. Kitchen has double wall oven, electric cooktop on island & built-in microwave. 4 bedrooms, 3 full baths w/one half bath, great for entertaining or relaxing w/ family. 2 full bedroom suites. Guest suite has adjoining private office area. Step outside to your backyard oasis, complete w/ an in-ground pool, outdoor shower & 35' x 30' concrete patio surrounded by 8' privacy fence. Gas connection on patio for outdoor grilling & entertaining. Whole House Generator w/ load management system -serviced regularly. 350 Gallon Propane tank w/ WIFI monitor, assuring generator service for 14 days at full load. 30-year architectural roof 4 years old. 3 AC units: 2 high efficiency heat pumps-approx 4 yrs old & 1 central AC/heat unit approx. 19 yrs old. Well system w/ water treatment plant, assuring clean, sterilized, PH balanced water entering home & pool. 2 solar hot water systems w/2- 80-gallon insulated storage tanks, each instant with, instant-on gas back up, assuring continuous hot water. Booster pump maintains 55 PSI water pressure to multi head showers & jacuzzi tub. Pool is 16 years old, the liner is 2 years old w/automated water management, forever water filter medium, water sterilization, copper infuser, minimizing chemical use. Electric pool cleaner & one battery operated cleaner included. Property is surrounded by trees & open land, offering country living w/ convenient access to local amenities. Whether you're looking for room to grow, space to entertain, or a quiet place to unwind, this property offers it all. Call Listing Agent for more details and to set up to view this beautiful home!!
***Chandelier in dining room WILL NOT BE SOLD WITH HOME, Seller will replace before sale***
Listing Agent
Crescent Sotheby's International Realty License #000055947 Listed on: 11/14/2025

Home Details
Home Type
- Single Family
Year Built
- Built in 2006
Lot Details
- 4.22 Acre Lot
- Fenced
- Oversized Lot
- Rectangular Lot
- Property is in excellent condition
Home Design
- Acadian Style Architecture
- Brick Exterior Construction
- Slab Foundation
- Shingle Roof
- Stucco
Interior Spaces
- 3,059 Sq Ft Home
- Property has 2 Levels
- Crown Molding
- Ceiling Fan
- Gas Fireplace
Kitchen
- Double Oven
- Cooktop
- Microwave
- Dishwasher
- Stainless Steel Appliances
- Granite Countertops
Bedrooms and Bathrooms
- 4 Bedrooms
- Soaking Tub
Home Security
- Home Security System
- Fire Sprinkler System
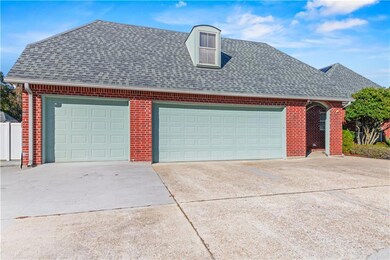
Parking
- 3 Car Garage
- Garage Door Opener
Pool
- In Ground Pool
- Outdoor Shower
Outdoor Features
- Shed
- Wrap Around Porch
Location
- Outside City Limits
Schools
- Call Elementary School
- School Board Middle School
- Information High School
Utilities
- Multiple cooling system units
- Multiple Heating Units
- Power Generator
- Well
- Septic Tank
Community Details
- Beau Place Subdivision
Listing and Financial Details
- Tax Lot 13
- Assessor Parcel Number 6178642
Map
Tax History
| Year | Tax Paid | Tax Assessment Tax Assessment Total Assessment is a certain percentage of the fair market value that is determined by local assessors to be the total taxable value of land and additions on the property. | Land | Improvement |
|---|---|---|---|---|
| 2024 | $1,834 | $23,908 | $2,254 | $21,654 |
| 2023 | $1,848 | $23,968 | $2,094 | $21,874 |
| 2022 | $1,848 | $23,968 | $2,094 | $21,874 |
| 2021 | $1,276 | $23,968 | $2,094 | $21,874 |
| 2020 | $1,848 | $23,968 | $2,094 | $21,874 |
| 2019 | $1,842 | $23,968 | $2,094 | $21,874 |
| 2018 | $1,849 | $23,968 | $2,094 | $21,874 |
| 2017 | $1,849 | $23,968 | $2,094 | $21,874 |
| 2016 | $1,849 | $23,968 | $2,094 | $21,874 |
| 2015 | $1,272 | $23,968 | $2,094 | $21,874 |
| 2014 | $1,271 | $23,968 | $2,094 | $21,874 |
Property History
| Date | Event | Price | List to Sale | Price per Sq Ft |
|---|---|---|---|---|
| 11/14/2025 11/14/25 | For Sale | $649,900 | -- | $212 / Sq Ft |
Purchase History
| Date | Type | Sale Price | Title Company |
|---|---|---|---|
| Deed | -- | Delta Title Corp |
Mortgage History
| Date | Status | Loan Amount | Loan Type |
|---|---|---|---|
| Open | $349,600 | New Conventional |
Source: ROAM MLS
MLS Number: 2530627
APN: 06178642
- 50277 (Lot 5) Allen Dr
- 50293 (Lot 3) Allen Dr
- 50320 (Lot 2) Allen Dr
- 50319 (Lot 1) Allen Dr
- 50278 (Lot 6) Allen Dr
- 21329 Louisiana 40
- 52007 Ditta Dr
- 51641 Narretto Rd
- TRACT 8 Cyprian Rd
- 49354 Ravenwood Dr
- 20187 Gleber Dr
- 20018 Bankston Ln
- 50273 La Highway 443
- 50335 La Highway 443
- 50371 La Highway 443
- 23144 Louisiana 40
- 23144 E Hwy 40 Other
- 54225 Passman Rd
- 48431 Fox Hollow Blvd
- 20598 Stone House Rd
- 18188 Red Wolf Trail
- 16248 Buddy D Ln
- 16308 Blossom Ln
- 44220 Louisiana 445
- 123 Lear Dr Unit A
- 44195 Shadowpoint Dr
- 44416 Deer Ridge Rd
- 49297 U S 51
- 20175 Long Lake Dr
- 1381 Us-190 Unit E
- 17597 Tangi Lake Dr
- 18017 Eastgate Dr Unit B
- 103 Mallard Dr Unit A
- 18007 E Gate Dr Unit A
- 43293 Quiet Lake Dr
Ask me questions while you tour the home.