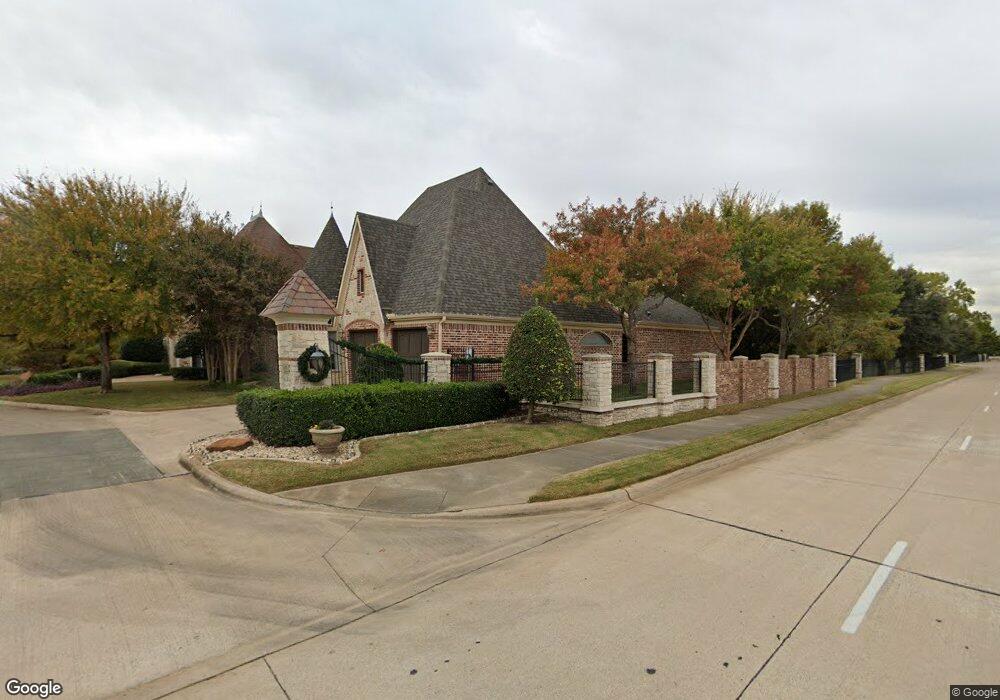
5144 Stonebridge Dr Colleyville, TX 76034
Estimated Value: $728,538 - $830,000
3
Beds
3
Baths
2,750
Sq Ft
$278/Sq Ft
Est. Value
About This Home
This home is located at 5144 Stonebridge Dr, Colleyville, TX 76034 and is currently estimated at $764,135, approximately $277 per square foot. 5144 Stonebridge Dr is a home located in Tarrant County with nearby schools including Bransford Elementary School, Colleyville Middle School, and Waypoint Montessori.
Ownership History
Date
Name
Owned For
Owner Type
Purchase Details
Closed on
Oct 27, 2022
Sold by
Irwin Patch Jr Revocable Trust
Bought by
Emma G Patch Revocable Trust
Current Estimated Value
Purchase Details
Closed on
May 27, 2004
Sold by
Philabaum Joseph E and Philabaum Nancy K
Bought by
Irwin Patch Jr Revocable Trust and Emma G Patch Revocable Trust
Purchase Details
Closed on
Dec 22, 2003
Sold by
Cambridge Homes Inc
Bought by
Philabaum Joseph E and Philabaum Nancy K
Home Financials for this Owner
Home Financials are based on the most recent Mortgage that was taken out on this home.
Original Mortgage
$317,400
Interest Rate
3%
Mortgage Type
Purchase Money Mortgage
Purchase Details
Closed on
Aug 22, 2002
Sold by
The Bridges At Riverwalk Ltd
Bought by
Cambridge Homes Inc
Home Financials for this Owner
Home Financials are based on the most recent Mortgage that was taken out on this home.
Original Mortgage
$63,750
Interest Rate
6.41%
Create a Home Valuation Report for This Property
The Home Valuation Report is an in-depth analysis detailing your home's value as well as a comparison with similar homes in the area
Home Values in the Area
Average Home Value in this Area
Purchase History
| Date | Buyer | Sale Price | Title Company |
|---|---|---|---|
| Emma G Patch Revocable Trust | -- | -- | |
| Irwin Patch Jr Revocable Trust | -- | Commonwealth Land | |
| Philabaum Joseph E | -- | -- | |
| Cambridge Homes Inc | -- | Commonwealth Land Title |
Source: Public Records
Mortgage History
| Date | Status | Borrower | Loan Amount |
|---|---|---|---|
| Previous Owner | Philabaum Joseph E | $317,400 | |
| Previous Owner | Cambridge Homes Inc | $63,750 | |
| Closed | Philabaum Joseph E | $39,650 |
Source: Public Records
Tax History Compared to Growth
Tax History
| Year | Tax Paid | Tax Assessment Tax Assessment Total Assessment is a certain percentage of the fair market value that is determined by local assessors to be the total taxable value of land and additions on the property. | Land | Improvement |
|---|---|---|---|---|
| 2025 | $2,098 | $765,577 | $150,000 | $615,577 |
| 2024 | $2,098 | $765,577 | $150,000 | $615,577 |
| 2023 | $9,852 | $686,194 | $120,000 | $566,194 |
| 2022 | $10,486 | $530,942 | $90,000 | $440,942 |
| 2021 | $10,855 | $494,291 | $90,000 | $404,291 |
| 2020 | $10,500 | $472,514 | $90,000 | $382,514 |
| 2019 | $10,966 | $474,313 | $90,000 | $384,313 |
| 2018 | $2,260 | $462,002 | $90,000 | $372,002 |
| 2017 | $9,922 | $493,518 | $90,000 | $403,518 |
| 2016 | $9,020 | $381,820 | $90,000 | $291,820 |
| 2015 | $7,337 | $432,700 | $60,000 | $372,700 |
| 2014 | $7,337 | $432,700 | $60,000 | $372,700 |
Source: Public Records
Map
Nearby Homes
- 5200 Preservation Ave
- 5104 Preservation Ave
- 1521 Four Seasons Dr
- 1505 Four Seasons Dr
- 1504 Four Seasons Dr
- 1533 Four Seasons Dr
- 1536 Four Seasons Dr
- 1513 Four Seasons Dr
- Lot 3 Amelia Ct
- 1517 Four Seasons Dr
- 1525 Four Seasons Dr
- 1532 Four Seasons Dr
- 1512 Four Seasons Dr
- 5317 Bluebonnet Dr
- 4812 Carmel Place
- 1104 Garry Lynne Dr
- 37 Piazza Ln
- Lot 4 Amelia Ct
- 4600 Westbury Dr
- 4600 Stafford Dr
- 5140 Stonebridge Dr
- 5143 Stonebridge Dr
- 5108 Stonebridge Dr
- 5145 Stonebridge Dr
- 5141 Stonebridge Dr
- 5137 Stonebridge Dr
- 5104 Stonebridge Dr
- 5121 Stonebridge Dr
- 5117 Stonebridge Dr
- 5125 Stonebridge Dr
- 5125 San Gabriel Ave
- 5129 Stonebridge Dr
- 5121 San Gabriel Ave
- 5129 San Gabriel Ave
- 5100 Stonebridge Dr
- 5117 San Gabriel Ave
- 5109 Stonebridge Dr
- 5131 San Gabriel Ave
- 5113 San Gabriel Ave
- 5028 Stonebridge Dr