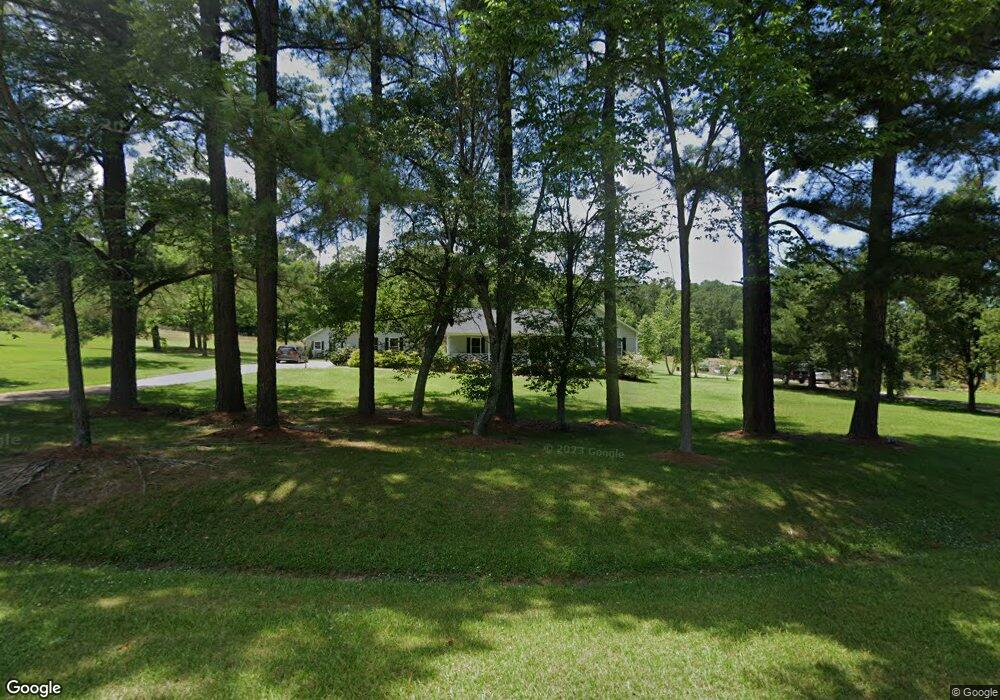
5145 Haycourt Ln Wendell, NC 27591
Estimated Value: $462,000 - $497,000
3
Beds
3
Baths
2,240
Sq Ft
$212/Sq Ft
Est. Value
About This Home
This home is located at 5145 Haycourt Ln, Wendell, NC 27591 and is currently estimated at $475,292, approximately $212 per square foot. 5145 Haycourt Ln is a home located in Wake County with nearby schools including Forestville Road Elementary School, Neuse River Middle School, and Knightdale High.
Ownership History
Date
Name
Owned For
Owner Type
Purchase Details
Closed on
May 30, 2018
Sold by
Clayton Justin L and Clayton Rebevva Barnes
Bought by
Cange Jason and Cange Constance
Current Estimated Value
Home Financials for this Owner
Home Financials are based on the most recent Mortgage that was taken out on this home.
Original Mortgage
$231,200
Outstanding Balance
$199,497
Interest Rate
4.4%
Mortgage Type
New Conventional
Estimated Equity
$275,795
Purchase Details
Closed on
May 12, 2015
Sold by
Ridlehoover Luther Nathan
Bought by
Clayton Justin L and Clayton Rebecca Barnes
Home Financials for this Owner
Home Financials are based on the most recent Mortgage that was taken out on this home.
Original Mortgage
$175,800
Interest Rate
3.77%
Mortgage Type
New Conventional
Purchase Details
Closed on
Feb 29, 1988
Bought by
Ridlehoover Luther N
Create a Home Valuation Report for This Property
The Home Valuation Report is an in-depth analysis detailing your home's value as well as a comparison with similar homes in the area
Home Values in the Area
Average Home Value in this Area
Purchase History
| Date | Buyer | Sale Price | Title Company |
|---|---|---|---|
| Cange Jason | $289,000 | None Available | |
| Clayton Justin L | $185,500 | None Available | |
| Ridlehoover Luther N | $112,000 | -- |
Source: Public Records
Mortgage History
| Date | Status | Borrower | Loan Amount |
|---|---|---|---|
| Open | Cange Jason | $231,200 | |
| Previous Owner | Clayton Justin L | $175,800 |
Source: Public Records
Tax History Compared to Growth
Tax History
| Year | Tax Paid | Tax Assessment Tax Assessment Total Assessment is a certain percentage of the fair market value that is determined by local assessors to be the total taxable value of land and additions on the property. | Land | Improvement |
|---|---|---|---|---|
| 2025 | $2,851 | $442,615 | $66,240 | $376,375 |
| 2024 | $2,769 | $442,615 | $66,240 | $376,375 |
| 2023 | $2,434 | $309,546 | $41,760 | $267,786 |
| 2022 | $2,256 | $309,546 | $41,760 | $267,786 |
| 2021 | $2,195 | $309,546 | $41,760 | $267,786 |
| 2020 | $2,159 | $309,546 | $41,760 | $267,786 |
| 2019 | $1,960 | $237,562 | $60,000 | $177,562 |
| 2018 | $1,803 | $237,562 | $60,000 | $177,562 |
| 2017 | $1,709 | $237,562 | $60,000 | $177,562 |
| 2016 | $1,675 | $213,408 | $60,000 | $153,408 |
| 2015 | $1,563 | $222,126 | $60,000 | $162,126 |
| 2014 | -- | $222,126 | $60,000 | $162,126 |
Source: Public Records
Map
Nearby Homes
- 5541 Watkins Rd
- 8641 Buffaloe Rd
- 8817 Wormsloe Dr
- 4341 Coldwater Springs Dr
- 4345 Coldwater Springs Dr
- 4332 Coldwater Springs Dr
- 4340 Coldwater Springs Dr
- 4356 Coldwater Springs Dr
- 4344 Coldwater Springs Dr
- CHANLEY Plan at Highlands Summit at Mark's Creek
- VANDERBURGH Plan at Highlands Summit at Mark's Creek
- BUCHANAN Plan at Highlands Summit at Mark's Creek
- KAYLEEN Plan at Highlands Summit at Mark's Creek
- HORIZON Plan at Highlands Summit at Mark's Creek
- BRANFORD Plan at Highlands Summit at Mark's Creek
- PARKETTE Plan at Highlands Summit at Mark's Creek
- SEBASTIAN Plan at Highlands Summit at Mark's Creek
- 5725 All Clear Ln
- 2028 Ruddy Rd
- 4457 Labrador Dr
- 5149 Haycourt Ln
- 5133 Haycourt Ln
- 5148 Haycourt Ln
- 5144 Haycourt Ln
- 5153 Haycourt Ln
- 5140 Haycourt Ln
- 5136 Haycourt Ln
- 5537 Watkins Rd
- 5152 Haycourt Ln
- 5101 Haycourt Ln
- 5128 Haycourt Ln
- 5116 Haycourt Ln
- 5100 Haycourt Ln
- 5521 Watkins Rd
- 5529 Watkins Rd
- 5709 Watkins Rd
- 5525 Watkins Rd
- 5608 Watkins Rd
- 1716 Rc Watson Rd
- 5520 Watkins Rd