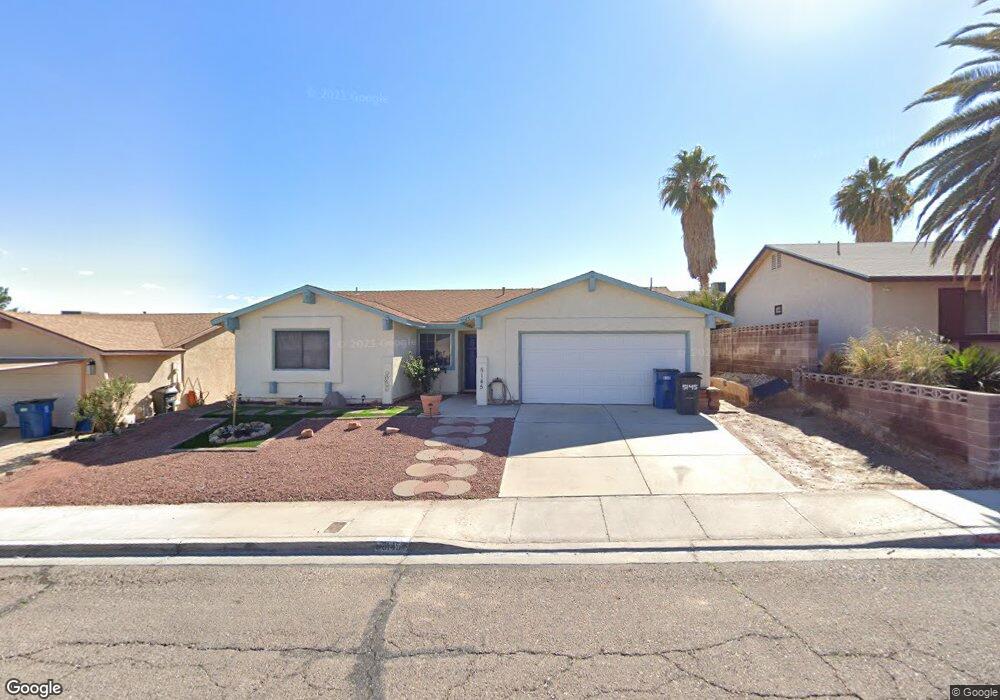
5145 Myrtlewood Ave Las Vegas, NV 89122
Estimated Value: $361,823 - $407,000
4
Beds
2
Baths
1,390
Sq Ft
$280/Sq Ft
Est. Value
About This Home
This home is located at 5145 Myrtlewood Ave, Las Vegas, NV 89122 and is currently estimated at $388,706, approximately $279 per square foot. 5145 Myrtlewood Ave is a home located in Clark County with nearby schools including Harley Harmon Elementary School, Francis H Cortney Junior High School, and Del Sol Academy of the Performing Arts.
Ownership History
Date
Name
Owned For
Owner Type
Purchase Details
Closed on
Feb 12, 2018
Sold by
Thomas Kenneth
Bought by
Thomas Kimberlee
Current Estimated Value
Home Financials for this Owner
Home Financials are based on the most recent Mortgage that was taken out on this home.
Original Mortgage
$145,000
Outstanding Balance
$122,678
Interest Rate
3.95%
Mortgage Type
New Conventional
Estimated Equity
$266,028
Purchase Details
Closed on
Jan 31, 2014
Sold by
Thomas Kenneth E
Bought by
Thomas Kimberlee
Home Financials for this Owner
Home Financials are based on the most recent Mortgage that was taken out on this home.
Original Mortgage
$15,000
Interest Rate
4.46%
Mortgage Type
Unknown
Purchase Details
Closed on
Jan 30, 2014
Sold by
Juniper Lp
Bought by
Thomas Kimberlee
Home Financials for this Owner
Home Financials are based on the most recent Mortgage that was taken out on this home.
Original Mortgage
$15,000
Interest Rate
4.46%
Mortgage Type
Unknown
Create a Home Valuation Report for This Property
The Home Valuation Report is an in-depth analysis detailing your home's value as well as a comparison with similar homes in the area
Home Values in the Area
Average Home Value in this Area
Purchase History
| Date | Buyer | Sale Price | Title Company |
|---|---|---|---|
| Thomas Kimberlee | -- | Ticor Title Las Vegas | |
| Thomas Kimberlee | -- | Old Republic Title Co | |
| Thomas Kimberlee | $70,000 | Old Republic Title Co |
Source: Public Records
Mortgage History
| Date | Status | Borrower | Loan Amount |
|---|---|---|---|
| Open | Thomas Kimberlee | $145,000 | |
| Closed | Thomas Kimberlee | $15,000 |
Source: Public Records
Tax History Compared to Growth
Tax History
| Year | Tax Paid | Tax Assessment Tax Assessment Total Assessment is a certain percentage of the fair market value that is determined by local assessors to be the total taxable value of land and additions on the property. | Land | Improvement |
|---|---|---|---|---|
| 2025 | $1,136 | $52,052 | $23,100 | $28,952 |
| 2024 | $1,052 | $52,052 | $23,100 | $28,952 |
| 2023 | $700 | $54,664 | $26,250 | $28,414 |
| 2022 | $975 | $48,359 | $22,050 | $26,309 |
| 2021 | $903 | $46,407 | $21,000 | $25,407 |
| 2020 | $835 | $43,413 | $17,850 | $25,563 |
| 2019 | $783 | $43,092 | $17,500 | $25,592 |
| 2018 | $747 | $39,537 | $14,700 | $24,837 |
| 2017 | $1,156 | $39,408 | $14,000 | $25,408 |
| 2016 | $700 | $33,529 | $7,350 | $26,179 |
| 2015 | $698 | $23,036 | $7,350 | $15,686 |
| 2014 | $676 | $22,668 | $5,250 | $17,418 |
Source: Public Records
Map
Nearby Homes
- 5030 E Hacienda Ave
- 5154 Brownwood Ave
- 5054 Brownwood Ave
- 5284 Wellesley Ave
- 5289 Chattanooga Ave
- 5068 Killarney St
- 4999 Nellis Cir
- 5073 Gains Mill St
- 5022 Carmel Ave Unit 3
- 5437 Morris St
- 5250 Vicksburg Ave
- 5359 Chattanooga Ave
- 5240 Fire Night Ave
- 5271 Ithaca Ave
- 4948 Orinda Cir Unit 5
- 5240 Denning St
- 4924 Elaina Ave
- 5457 Tunis Ave
- 4990 Denning St
- 4805 Terra Linda Ave
- 5135 Myrtlewood Ave
- 5155 Myrtlewood Ave
- 5138 Maple Tree Ave
- 5128 Maple Tree Ave
- 5125 Myrtlewood Ave
- 5148 Maple Tree Ave
- 5118 Maple Tree Ave
- 5144 Myrtlewood Ave
- 5134 Myrtlewood Ave
- 5154 Myrtlewood Ave
- 5115 Myrtlewood Ave
- 5124 Myrtlewood Ave
- 5108 Maple Tree Ave
- 5204 Pinetree St
- 5208 Pinetree St
- 5198 Pinetree St
- 5114 Myrtlewood Ave
- 5250 Pinetree St
- 5107 Myrtlewood Ave
- 5192 Pinetree St