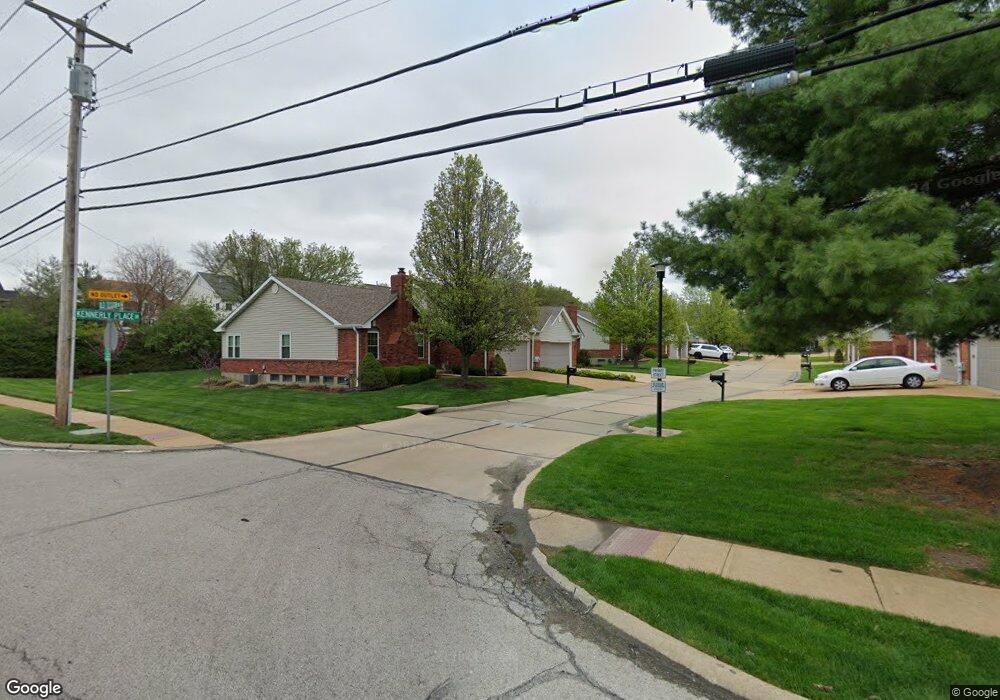
5149 Kennerly Place Dr Unit 2B Saint Louis, MO 63128
Estimated Value: $347,000 - $405,696
2
Beds
3
Baths
1,478
Sq Ft
$253/Sq Ft
Est. Value
About This Home
This home is located at 5149 Kennerly Place Dr Unit 2B, Saint Louis, MO 63128 and is currently estimated at $373,424, approximately $252 per square foot. 5149 Kennerly Place Dr Unit 2B is a home located in St. Louis County with nearby schools including Kennerly Elementary School, Sperreng Middle School, and Lindbergh High School.
Ownership History
Date
Name
Owned For
Owner Type
Purchase Details
Closed on
Sep 13, 2019
Sold by
Klipsch William E and Klipsch Joann L
Bought by
Biljo Llc
Current Estimated Value
Purchase Details
Closed on
Nov 7, 2008
Sold by
Klipsch Joann L and Klipsch William E
Bought by
Klipsch Joann L and Klipsch William E
Home Financials for this Owner
Home Financials are based on the most recent Mortgage that was taken out on this home.
Original Mortgage
$230,280
Interest Rate
6.5%
Mortgage Type
FHA
Purchase Details
Closed on
Apr 14, 2003
Sold by
Cullmann Roland Donald and Cullmann Gene Paul
Bought by
Klipsch Joann L
Home Financials for this Owner
Home Financials are based on the most recent Mortgage that was taken out on this home.
Original Mortgage
$176,000
Interest Rate
5.64%
Mortgage Type
Purchase Money Mortgage
Create a Home Valuation Report for This Property
The Home Valuation Report is an in-depth analysis detailing your home's value as well as a comparison with similar homes in the area
Home Values in the Area
Average Home Value in this Area
Purchase History
| Date | Buyer | Sale Price | Title Company |
|---|---|---|---|
| Biljo Llc | $260,000 | Us Title Clayton Escrow | |
| Klipsch Joann L | -- | Integrity Land Title Co Inc | |
| Klipsch Joann L | $220,000 | -- |
Source: Public Records
Mortgage History
| Date | Status | Borrower | Loan Amount |
|---|---|---|---|
| Previous Owner | Klipsch Joann L | $230,280 | |
| Previous Owner | Klipsch Joann L | $176,000 | |
| Closed | Klipsch Joann L | $41,800 |
Source: Public Records
Tax History Compared to Growth
Tax History
| Year | Tax Paid | Tax Assessment Tax Assessment Total Assessment is a certain percentage of the fair market value that is determined by local assessors to be the total taxable value of land and additions on the property. | Land | Improvement |
|---|---|---|---|---|
| 2025 | $3,602 | $55,060 | $11,230 | $43,830 |
| 2024 | $3,602 | $55,340 | $7,710 | $47,630 |
| 2023 | $3,594 | $55,340 | $7,710 | $47,630 |
| 2022 | $3,074 | $45,370 | $9,270 | $36,100 |
| 2021 | $2,965 | $45,370 | $9,270 | $36,100 |
| 2020 | $2,901 | $42,820 | $9,270 | $33,550 |
| 2019 | $2,893 | $42,820 | $9,270 | $33,550 |
| 2018 | $3,041 | $40,960 | $5,620 | $35,340 |
| 2017 | $3,008 | $40,960 | $5,620 | $35,340 |
| 2016 | $2,852 | $36,860 | $8,420 | $28,440 |
| 2015 | $2,809 | $36,860 | $8,420 | $28,440 |
| 2014 | $1,967 | $25,450 | $7,680 | $17,770 |
Source: Public Records
Map
Nearby Homes
- 4801 Langtree Dr
- 5100 Melitta Dr
- 5135 Towne Centre Dr
- 4645 Tauneybrook Dr
- 4839 Hursley Dr
- 10016 Schuessler Rd
- 4833 Hursley Dr
- 4942 Caribee Dr
- 4643 Littlebury Dr
- 10124 Carolynne Dr
- 5057 Peyton Place Ct
- 10033 Carolynne Dr
- 4947 Butler Hill Rd
- 4915 Butler Hill Rd
- 10026 Canterbury Farms Ct
- 4818 Chapel Hill Dr
- 10315 Kennerly Rd
- 10652 Roanna Ln
- 12055 Charwick Dr
- 5263 Faro Dr
- 5157 Kennerly Place Dr Unit 2A
- 5133 Kennerly Place Dr
- 5148 Kennerly Place Dr
- 5156 Kennerly Place Dr
- 5130 Kennerly Pines Ct
- 5132 Kennerly Place Dr
- 5124 Kennerly Pines Ct
- 9900 Kennerly Rd
- 5125 Kennerly Place Dr
- 5117 Kennerly Place Dr
- 12624 Old Tesson Rd
- 5118 Kennerly Pines Ct
- 5124 Kennerly Place Dr Unit 5A
- 5116 Kennerly Place Dr
- 5135 Kennerly Pines Ct
- 5129 Kennerly Pines Ct
- 5112 Kennerly Pines Ct
- 9906 Kennerly Rd
- 5123 Kennerly Pines Ct
- 5117 Melitta Dr