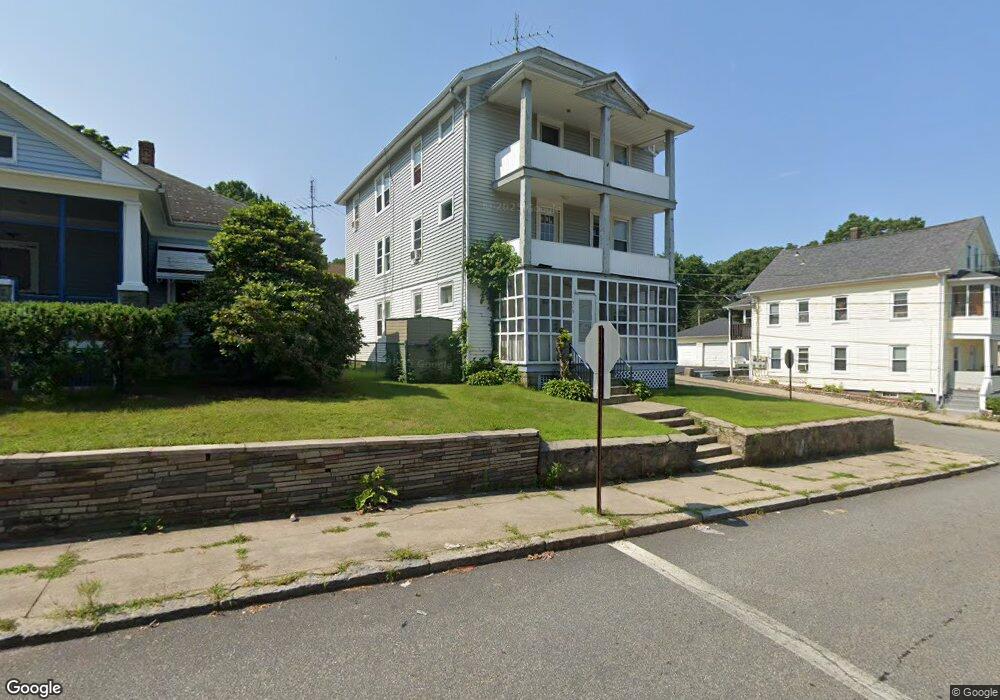
515 Ballou St Woonsocket, RI 02895
Globe District NeighborhoodEstimated Value: $517,264 - $615,000
9
Beds
3
Baths
44
Sq Ft
$13,041/Sq Ft
Est. Value
About This Home
This home is located at 515 Ballou St, Woonsocket, RI 02895 and is currently estimated at $573,816, approximately $13,041 per square foot. 515 Ballou St is a home located in Providence County with nearby schools including Woonsocket High School, Founders Academy, and Beacon Charter School.
Ownership History
Date
Name
Owned For
Owner Type
Purchase Details
Closed on
Aug 5, 2003
Sold by
Opitz Roger J
Bought by
Kegbeh Wallace and Blackie Garmehn
Current Estimated Value
Home Financials for this Owner
Home Financials are based on the most recent Mortgage that was taken out on this home.
Original Mortgage
$231,350
Outstanding Balance
$97,658
Interest Rate
5.28%
Mortgage Type
Purchase Money Mortgage
Estimated Equity
$476,158
Purchase Details
Closed on
Jun 1, 1995
Sold by
Lambert Antoinette G
Bought by
Opitz Roger J and Opitz Marguerite
Create a Home Valuation Report for This Property
The Home Valuation Report is an in-depth analysis detailing your home's value as well as a comparison with similar homes in the area
Home Values in the Area
Average Home Value in this Area
Purchase History
| Date | Buyer | Sale Price | Title Company |
|---|---|---|---|
| Kegbeh Wallace | $235,000 | -- | |
| Kegbeh Wallace | $235,000 | -- | |
| Opitz Roger J | $109,000 | -- | |
| Opitz Roger J | $109,000 | -- |
Source: Public Records
Mortgage History
| Date | Status | Borrower | Loan Amount |
|---|---|---|---|
| Open | Opitz Roger J | $231,350 | |
| Closed | Opitz Roger J | $231,350 | |
| Previous Owner | Opitz Roger J | $120,000 |
Source: Public Records
Tax History
| Year | Tax Paid | Tax Assessment Tax Assessment Total Assessment is a certain percentage of the fair market value that is determined by local assessors to be the total taxable value of land and additions on the property. | Land | Improvement |
|---|---|---|---|---|
| 2025 | $6,727 | $599,000 | $101,400 | $497,600 |
| 2024 | $5,301 | $364,600 | $89,900 | $274,700 |
| 2023 | $5,097 | $364,600 | $89,900 | $274,700 |
| 2022 | $5,097 | $364,600 | $89,900 | $274,700 |
| 2021 | $4,313 | $181,600 | $55,000 | $126,600 |
| 2020 | $4,358 | $181,600 | $55,000 | $126,600 |
| 2018 | $4,373 | $181,600 | $55,000 | $126,600 |
| 2017 | $4,885 | $162,300 | $44,200 | $118,100 |
| 2016 | $5,168 | $162,300 | $44,200 | $118,100 |
| 2015 | $5,937 | $162,300 | $44,200 | $118,100 |
| 2014 | $5,526 | $158,500 | $48,600 | $109,900 |
Source: Public Records
Map
Nearby Homes
- 1 Admiral St
- 103 Elmore Ave
- 87 Kermit St
- 42 Transit St
- 122 Grand St
- 43 Summit St
- 184 Avenue C Unit 2
- 184 Avenue C Unit 5
- 184 Avenue C Unit 6
- 184 Avenue C Unit 3
- 184 Avenue C Unit 4
- 184 Avenue C Unit 1
- 136 Hemond Ave
- 109 Hemond Ave
- 15 Knight St
- 190 Coe St
- 59 Cooper Ave
- 0 Irving Lot 192 Ave Unit 1383138
- 0 Cranston St
- 435 S Main St
Your Personal Tour Guide
Ask me questions while you tour the home.