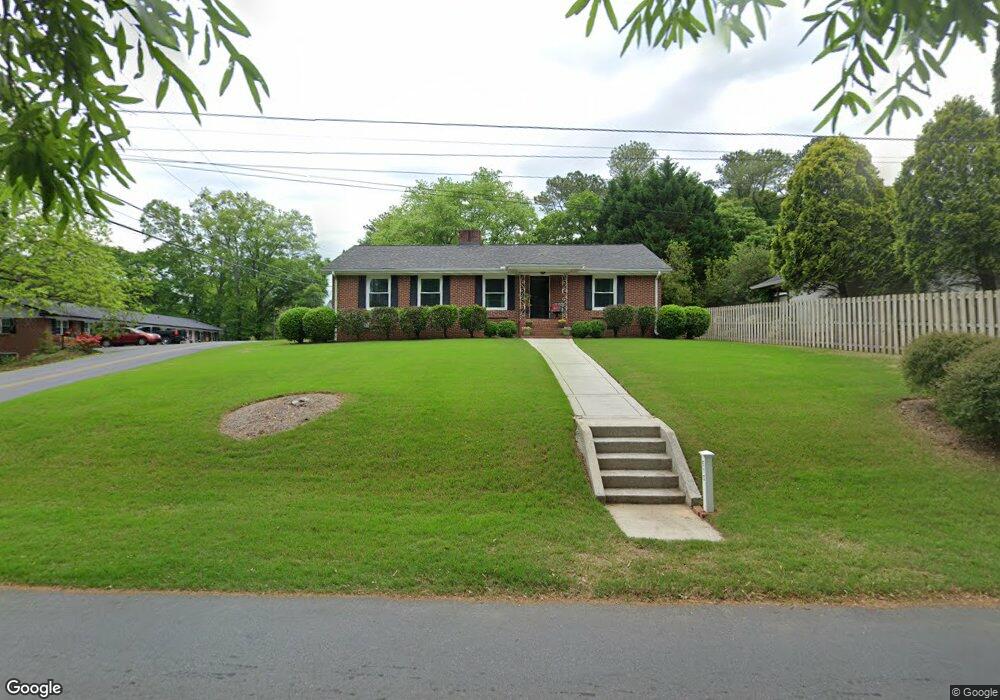
515 Boulevard Heights Calhoun, GA 30701
Estimated Value: $249,368 - $307,000
3
Beds
2
Baths
1,680
Sq Ft
$164/Sq Ft
Est. Value
About This Home
This home is located at 515 Boulevard Heights, Calhoun, GA 30701 and is currently estimated at $275,592, approximately $164 per square foot. 515 Boulevard Heights is a home located in Gordon County with nearby schools including Calhoun Elementary School, Calhoun Middle School, and Calhoun High School.
Ownership History
Date
Name
Owned For
Owner Type
Purchase Details
Closed on
Dec 7, 2021
Sold by
Adcock Mitzi W
Bought by
Adcock Mitzi W and Mitzi W Adcock Irrev Trust
Current Estimated Value
Purchase Details
Closed on
May 29, 2019
Sold by
Buse Troy Jon
Bought by
Adcock Mitzi W
Home Financials for this Owner
Home Financials are based on the most recent Mortgage that was taken out on this home.
Original Mortgage
$150,010
Interest Rate
4.1%
Mortgage Type
New Conventional
Purchase Details
Closed on
Nov 15, 2007
Sold by
Buse Troy J and Buse Karen R
Bought by
Buse Troy J
Purchase Details
Closed on
Feb 11, 2005
Sold by
Smith Kevin P
Bought by
Buse Troy J and Buse Karen R
Purchase Details
Closed on
Aug 8, 2000
Sold by
Mclure Robert Gordon
Bought by
Smith Kevin P
Create a Home Valuation Report for This Property
The Home Valuation Report is an in-depth analysis detailing your home's value as well as a comparison with similar homes in the area
Purchase History
| Date | Buyer | Sale Price | Title Company |
|---|---|---|---|
| Adcock Mitzi W | -- | -- | |
| Adcock Mitzi W | $154,650 | -- | |
| Buse Troy J | -- | -- | |
| Buse Troy J | $127,800 | -- | |
| Smith Kevin P | $73,500 | -- |
Source: Public Records
Mortgage History
| Date | Status | Borrower | Loan Amount |
|---|---|---|---|
| Previous Owner | Adcock Mitzi W | $150,010 |
Source: Public Records
Tax History
| Year | Tax Paid | Tax Assessment Tax Assessment Total Assessment is a certain percentage of the fair market value that is determined by local assessors to be the total taxable value of land and additions on the property. | Land | Improvement |
|---|---|---|---|---|
| 2025 | $865 | $78,960 | $7,080 | $71,880 |
| 2023 | $1,135 | $63,600 | $6,760 | $56,840 |
| 2022 | $556 | $60,440 | $7,040 | $53,400 |
| 2021 | $819 | $51,720 | $7,560 | $44,160 |
| 2020 | $846 | $52,440 | $7,560 | $44,880 |
| 2019 | $1,529 | $51,040 | $7,560 | $43,480 |
| 2018 | $425 | $44,120 | $7,160 | $36,960 |
| 2017 | $415 | $42,200 | $7,160 | $35,040 |
| 2016 | $416 | $42,200 | $7,160 | $35,040 |
| 2015 | $396 | $39,640 | $7,160 | $32,480 |
| 2014 | $340 | $34,520 | $6,430 | $28,091 |
Source: Public Records
Map
Nearby Homes
- 511 Boulevard Heights
- 421 Boulevard Heights
- 111 Meadow Ln
- 105 Garden Hill Dr
- 606 Pisgah Way
- 515 Woodlawn Ave
- 121 Hunt Dr
- 121 Oakhurst Terrace NE
- 229 Hillcrest Dr
- 709 College St
- 201 Crestmont Dr
- 622 Pisgah Way
- 712 College St
- 136 Meadow Ln
- 110 Boston Rd
- 209 Gordon Ave
- 103 Mims Dr
- 105 Rory Dr
- 107 Rory Dr
- 104 Bobwhite Dr
- 101 Buena Vista Dr
- 507 Boulevard Heights
- 508 Boulevard Heights
- 504 Boulevard Heights
- 100 Hunt Dr
- 603 Boulevard Heights
- 101 Hunt Dr
- 110 Woodrow St
- 103 Buena Vista Dr
- 102 Buena Vista Dr
- 612 Boulevard Heights
- 609 Boulevard Heights
- 103 Hunt Dr
- 418 Boulevard Heights
- 615 Boulevard Heights
- 100 Anabel Ln
- 100 Woodrow St
- 412 Boulevard Heights
- 423 Boulevard Heights
- 106 Buena Vista Dr
Your Personal Tour Guide
Ask me questions while you tour the home.