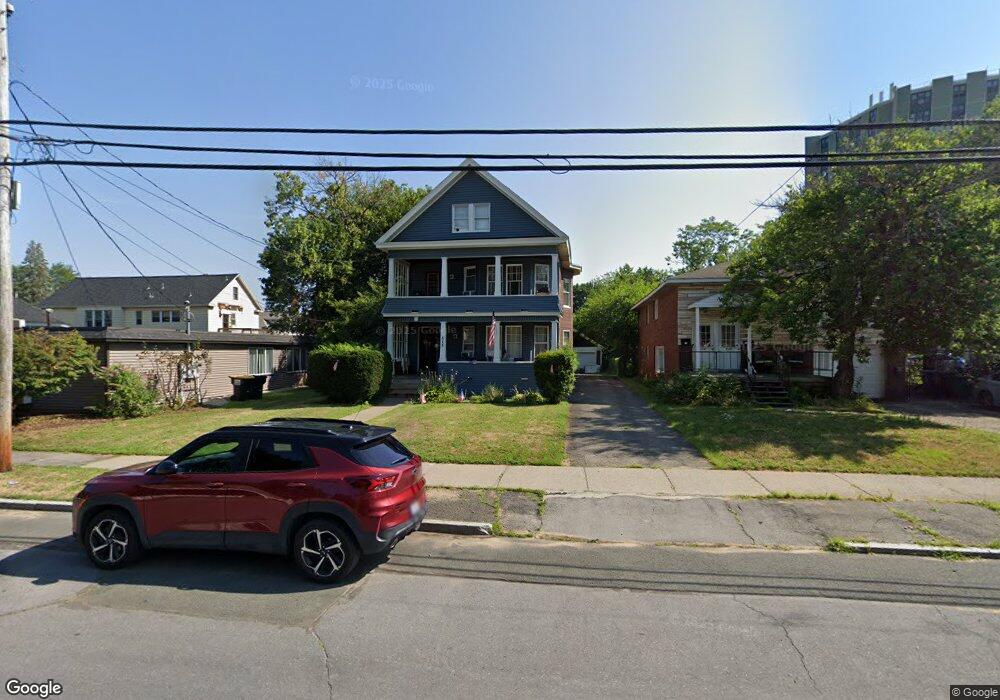
515 Bradford St Albany, NY 12206
Upper Washington Avenue NeighborhoodEstimated Value: $302,000 - $437,708
6
Beds
3
Baths
2,708
Sq Ft
$139/Sq Ft
Est. Value
About This Home
This home is located at 515 Bradford St, Albany, NY 12206 and is currently estimated at $377,677, approximately $139 per square foot. 515 Bradford St is a home located in Albany County with nearby schools including Pine Hills Elementary School, Stephen And Harriet Myers Middle School, and Albany High School.
Ownership History
Date
Name
Owned For
Owner Type
Purchase Details
Closed on
Jan 27, 2020
Sold by
Mantekas Gregory and Mantekas Artemis
Bought by
Mantekas Properties Llc
Current Estimated Value
Purchase Details
Closed on
Oct 26, 2005
Sold by
Invstrs Ny Prop
Bought by
Mantekas Gregory
Home Financials for this Owner
Home Financials are based on the most recent Mortgage that was taken out on this home.
Original Mortgage
$184,000
Outstanding Balance
$98,935
Interest Rate
5.93%
Mortgage Type
New Conventional
Estimated Equity
$278,742
Purchase Details
Closed on
Sep 2, 2005
Sold by
Bongiovanni Mary E
Bought by
Ny Prop Investors Llc
Home Financials for this Owner
Home Financials are based on the most recent Mortgage that was taken out on this home.
Original Mortgage
$184,000
Outstanding Balance
$98,935
Interest Rate
5.93%
Mortgage Type
New Conventional
Estimated Equity
$278,742
Purchase Details
Closed on
Jun 15, 2005
Sold by
Clark Elizabeth
Bought by
Bongiovanni Mary
Create a Home Valuation Report for This Property
The Home Valuation Report is an in-depth analysis detailing your home's value as well as a comparison with similar homes in the area
Home Values in the Area
Average Home Value in this Area
Purchase History
| Date | Buyer | Sale Price | Title Company |
|---|---|---|---|
| Mantekas Properties Llc | -- | None Available | |
| Mantekas Gregory | $231,000 | Yordan Huban | |
| Ny Prop Investors Llc | $195,000 | Steven Farer | |
| Bongiovanni Mary | -- | -- |
Source: Public Records
Mortgage History
| Date | Status | Borrower | Loan Amount |
|---|---|---|---|
| Open | Mantekas Gregory | $184,000 | |
| Closed | Mantekas Gregory | $34,500 |
Source: Public Records
Tax History Compared to Growth
Tax History
| Year | Tax Paid | Tax Assessment Tax Assessment Total Assessment is a certain percentage of the fair market value that is determined by local assessors to be the total taxable value of land and additions on the property. | Land | Improvement |
|---|---|---|---|---|
| 2024 | $7,314 | $276,000 | $55,200 | $220,800 |
| 2023 | $9,809 | $242,000 | $48,400 | $193,600 |
| 2022 | $9,597 | $242,000 | $48,400 | $193,600 |
| 2021 | $9,576 | $242,000 | $48,400 | $193,600 |
| 2020 | $9,205 | $242,000 | $48,400 | $193,600 |
| 2019 | $9,528 | $242,000 | $48,400 | $193,600 |
| 2018 | $9,204 | $242,000 | $48,400 | $193,600 |
| 2017 | $3,664 | $242,000 | $48,400 | $193,600 |
| 2016 | $9,077 | $242,000 | $48,400 | $193,600 |
| 2015 | $8,808 | $240,000 | $50,100 | $189,900 |
| 2014 | -- | $240,000 | $50,100 | $189,900 |
Source: Public Records
Map
Nearby Homes
- 30 Willow St
- 61 Lincoln Ave
- 15 Buchanan St
- 40 Garfield Place
- 282 Manning Blvd
- 38 Garfield Place
- 349 Manning Blvd
- 866 Washington Ave
- 860 Washington Ave
- 857 Livingston Ave
- 959 Washington Ave
- 129 N Pine Ave
- 118 N Allen St
- 948 Washington Ave
- 950 Washington Ave
- 160 Manning Blvd
- 112 N Allen St
- 3 Manning Square
- 81 N Main Ave
- 38 Danker Ave