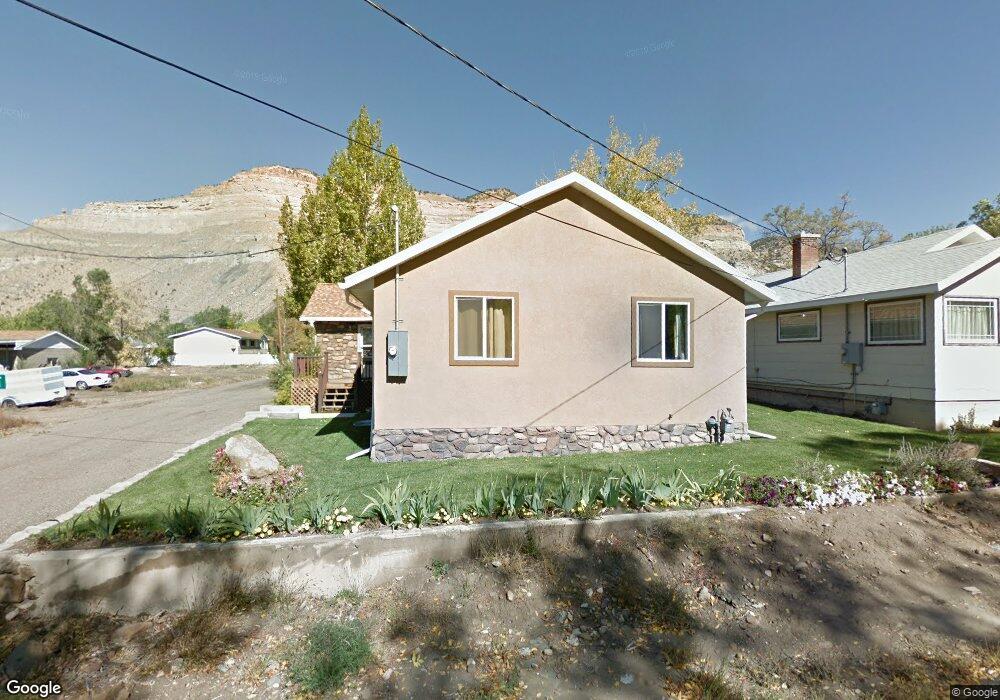
515 Cedar St Helper, UT 84526
Estimated Value: $153,000 - $220,000
Studio
--
Bath
804
Sq Ft
$236/Sq Ft
Est. Value
About This Home
This home is located at 515 Cedar St, Helper, UT 84526 and is currently estimated at $189,566, approximately $235 per square foot. 515 Cedar St is a home located in Carbon County with nearby schools including Sally Mauro School, Helper Middle School, and Carbon High School.
Ownership History
Date
Name
Owned For
Owner Type
Purchase Details
Closed on
Jul 14, 2022
Sold by
Rash Trent W
Bought by
Kutkas Anthony M
Current Estimated Value
Home Financials for this Owner
Home Financials are based on the most recent Mortgage that was taken out on this home.
Original Mortgage
$156,565
Outstanding Balance
$148,736
Interest Rate
5.09%
Mortgage Type
New Conventional
Estimated Equity
$40,830
Purchase Details
Closed on
Oct 24, 2011
Sold by
Powell Floyd and Powell Kathleen
Bought by
Rash Trent W
Home Financials for this Owner
Home Financials are based on the most recent Mortgage that was taken out on this home.
Original Mortgage
$73,979
Interest Rate
4.02%
Purchase Details
Closed on
Nov 23, 2010
Sold by
Burnham Gary and Burnham Charlene
Bought by
Morley Tasha and Morley Marilyn
Purchase Details
Closed on
Feb 18, 2001
Sold by
Morley Tasha and Daniels Craig
Bought by
Powell Floyd and Powell Kathleen
Create a Home Valuation Report for This Property
The Home Valuation Report is an in-depth analysis detailing your home's value as well as a comparison with similar homes in the area
Home Values in the Area
Average Home Value in this Area
Purchase History
| Date | Buyer | Sale Price | Title Company |
|---|---|---|---|
| Kutkas Anthony M | -- | None Listed On Document | |
| Rash Trent W | -- | -- | |
| Morley Tasha | -- | Professional Title Services | |
| Powell Floyd | -- | -- |
Source: Public Records
Mortgage History
| Date | Status | Borrower | Loan Amount |
|---|---|---|---|
| Open | Kutkas Anthony M | $156,565 | |
| Previous Owner | Rash Trent W | $73,979 |
Source: Public Records
Tax History
| Year | Tax Paid | Tax Assessment Tax Assessment Total Assessment is a certain percentage of the fair market value that is determined by local assessors to be the total taxable value of land and additions on the property. | Land | Improvement |
|---|---|---|---|---|
| 2025 | $641 | $50,165 | $10,382 | $39,783 |
| 2024 | $852 | $68,995 | $13,994 | $55,001 |
| 2023 | $826 | $70,046 | $17,185 | $52,861 |
| 2022 | $720 | $53,704 | $11,916 | $41,787 |
| 2021 | $630 | $73,654 | $15,300 | $58,354 |
| 2020 | $606 | $35,611 | $0 | $0 |
| 2019 | $577 | $34,946 | $0 | $0 |
| 2018 | $560 | $34,946 | $0 | $0 |
| 2017 | $554 | $34,946 | $0 | $0 |
| 2016 | $508 | $34,946 | $0 | $0 |
| 2015 | $508 | $34,946 | $0 | $0 |
| 2014 | $411 | $28,393 | $0 | $0 |
| 2013 | $412 | $28,393 | $0 | $0 |
Source: Public Records
Map
Nearby Homes
Your Personal Tour Guide
Ask me questions while you tour the home.