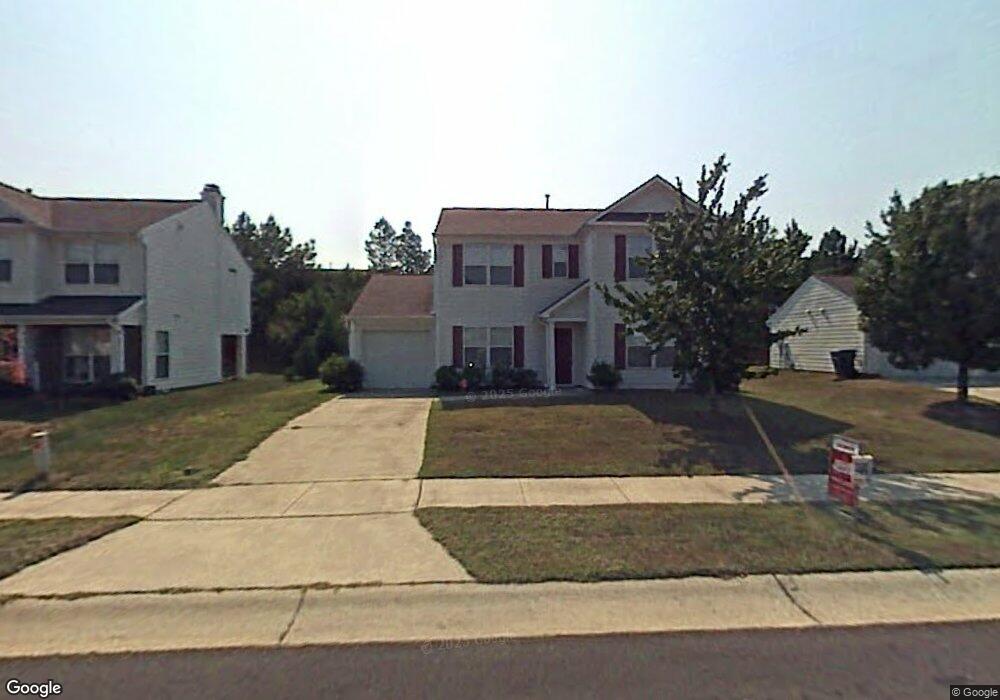
515 Crossview Ln Durham, NC 27703
Eastern Durham NeighborhoodEstimated Value: $314,000 - $384,000
3
Beds
3
Baths
1,703
Sq Ft
$209/Sq Ft
Est. Value
About This Home
This home is located at 515 Crossview Ln, Durham, NC 27703 and is currently estimated at $355,449, approximately $208 per square foot. 515 Crossview Ln is a home located in Durham County with nearby schools including Oak Grove Elementary, John W Neal Middle School, and Southern School of Energy & Sustainability.
Ownership History
Date
Name
Owned For
Owner Type
Purchase Details
Closed on
Apr 26, 2007
Sold by
Lee Michael
Bought by
Lee Kesha
Current Estimated Value
Purchase Details
Closed on
Aug 31, 2000
Sold by
D R Horton Inc Torrey
Bought by
Lee Michael and Lee Kesha
Home Financials for this Owner
Home Financials are based on the most recent Mortgage that was taken out on this home.
Original Mortgage
$151,700
Interest Rate
8.24%
Create a Home Valuation Report for This Property
The Home Valuation Report is an in-depth analysis detailing your home's value as well as a comparison with similar homes in the area
Home Values in the Area
Average Home Value in this Area
Purchase History
| Date | Buyer | Sale Price | Title Company |
|---|---|---|---|
| Lee Kesha | -- | None Available | |
| Lee Michael | $152,000 | -- |
Source: Public Records
Mortgage History
| Date | Status | Borrower | Loan Amount |
|---|---|---|---|
| Previous Owner | Lee Michael | $151,700 |
Source: Public Records
Tax History
| Year | Tax Paid | Tax Assessment Tax Assessment Total Assessment is a certain percentage of the fair market value that is determined by local assessors to be the total taxable value of land and additions on the property. | Land | Improvement |
|---|---|---|---|---|
| 2025 | $3,305 | $333,407 | $59,668 | $273,739 |
| 2024 | $2,716 | $194,726 | $43,575 | $151,151 |
| 2023 | $2,551 | $194,726 | $43,575 | $151,151 |
| 2022 | $2,492 | $194,726 | $43,575 | $151,151 |
| 2021 | $2,481 | $194,726 | $43,575 | $151,151 |
| 2020 | $2,422 | $194,726 | $43,575 | $151,151 |
| 2019 | $2,422 | $194,726 | $43,575 | $151,151 |
| 2018 | $2,073 | $152,832 | $31,955 | $120,877 |
| 2017 | $2,058 | $152,832 | $31,955 | $120,877 |
| 2016 | $1,988 | $152,832 | $31,955 | $120,877 |
| 2015 | $2,249 | $162,492 | $30,629 | $131,863 |
| 2014 | $2,249 | $162,492 | $30,629 | $131,863 |
Source: Public Records
Map
Nearby Homes
- 604 Bellmeade Bay Dr
- 501 Bellmeade Bay Dr
- 411 Bellmeade Bay Dr
- 615 Southshore Pkwy
- 3908 Holder Rd
- 4 Jarvis Ct
- 907 Danbury Dr
- 601 Crossing Dr
- 210 Stoney Creek Cir
- 208 Lick Creek Ln
- 1315 Pennock Rd
- 110 Kindlewood Dr
- 442 Gus Rd
- 1107 High Fox Dr
- 517 Keith St
- 1015 Sora Way
- 102 Harvest Oaks Ln Unit 38
- 610 Sherron Rd
- 107 Crosswood Dr
- 111 Glenview Ln
- 517 Crossview Ln
- 513 Crossview Ln
- BM359 Crossview Ln
- BM445 Crossview Ln
- BM345 Crossview Ln
- LT363 Crossview Ln
- BM364 Crossview Dr
- BM358 Crossview Ln
- BM361 Crossview Ln
- BM355 Crossview Ln
- BM342 Crossview Ln
- BM360 Crossview Ln
- BM368 Crossview Ln
- BM441 Crossview Ln
- BM448 Crossview Ln
- BM442 Crossview Ln
- BM446 Crossview Ln
- BM354 Crossview Ln
- BM344 Crossview Ln
- BM447 Crossview Ln
Your Personal Tour Guide
Ask me questions while you tour the home.