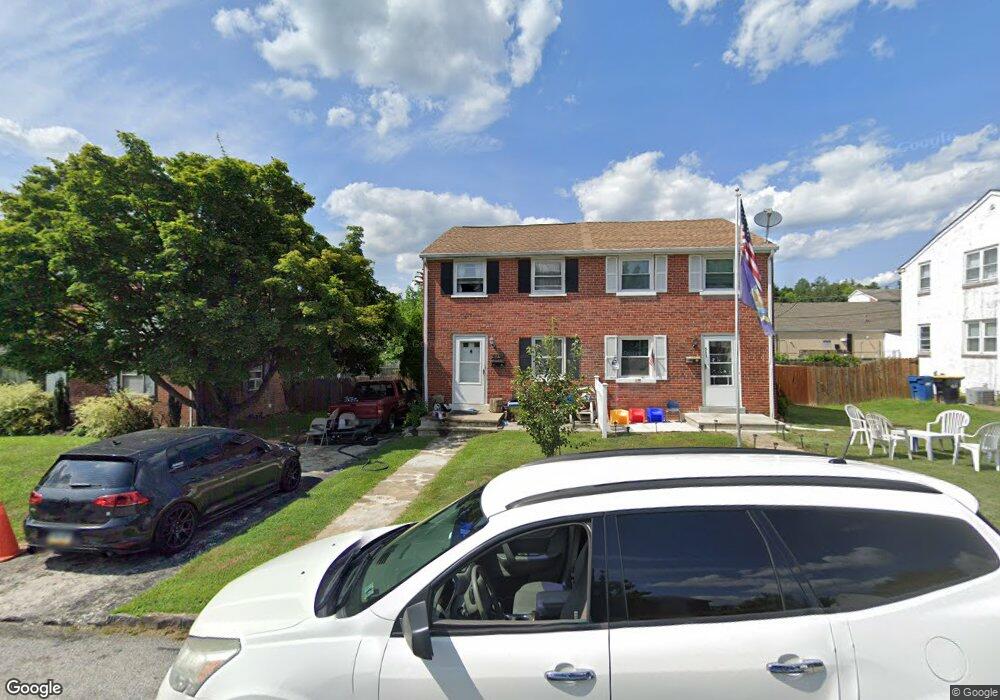
515 D St Kennett Square, PA 19348
Estimated Value: $304,000 - $347,000
3
Beds
1
Bath
992
Sq Ft
$328/Sq Ft
Est. Value
About This Home
This home is located at 515 D St, Kennett Square, PA 19348 and is currently estimated at $324,903, approximately $327 per square foot. 515 D St is a home located in Chester County with nearby schools including Kennett Middle School, Kennett High School, and St. Patrick School.
Ownership History
Date
Name
Owned For
Owner Type
Purchase Details
Closed on
Jan 23, 2026
Sold by
Moreno Angel Abila and Lopez Julio
Bought by
Lopez Maria Angelica Avi
Current Estimated Value
Purchase Details
Closed on
Jan 11, 2008
Sold by
Nazario Jose V and Burgos Maricruz
Bought by
Lopez Moreno Angel Abila and Lopez De Avila Martina
Home Financials for this Owner
Home Financials are based on the most recent Mortgage that was taken out on this home.
Original Mortgage
$172,296
Interest Rate
6.17%
Mortgage Type
FHA
Purchase Details
Closed on
Mar 30, 2000
Sold by
Alliance For Better Housing Inc
Bought by
Nazario Jose V and Burgos Maricruz
Home Financials for this Owner
Home Financials are based on the most recent Mortgage that was taken out on this home.
Original Mortgage
$85,000
Interest Rate
8.3%
Purchase Details
Closed on
May 6, 1999
Sold by
Lewis Alan D
Bought by
Alliance For Better Housing Inc
Home Financials for this Owner
Home Financials are based on the most recent Mortgage that was taken out on this home.
Original Mortgage
$90,000
Interest Rate
7.09%
Create a Home Valuation Report for This Property
The Home Valuation Report is an in-depth analysis detailing your home's value as well as a comparison with similar homes in the area
Home Values in the Area
Average Home Value in this Area
Purchase History
| Date | Buyer | Sale Price | Title Company |
|---|---|---|---|
| Lopez Maria Angelica Avi | -- | None Listed On Document | |
| Lopez Moreno Angel Abila | $175,000 | None Available | |
| Nazario Jose V | $85,000 | -- | |
| Alliance For Better Housing Inc | $48,860 | Fidelity National Title Ins |
Source: Public Records
Mortgage History
| Date | Status | Borrower | Loan Amount |
|---|---|---|---|
| Previous Owner | Lopez Moreno Angel Abila | $172,296 | |
| Previous Owner | Nazario Jose V | $85,000 | |
| Previous Owner | Alliance For Better Housing Inc | $90,000 |
Source: Public Records
Tax History
| Year | Tax Paid | Tax Assessment Tax Assessment Total Assessment is a certain percentage of the fair market value that is determined by local assessors to be the total taxable value of land and additions on the property. | Land | Improvement |
|---|---|---|---|---|
| 2025 | $3,874 | $79,510 | $25,410 | $54,100 |
| 2024 | $3,874 | $79,510 | $25,410 | $54,100 |
| 2023 | $3,756 | $79,510 | $25,410 | $54,100 |
| 2022 | $3,433 | $79,510 | $25,410 | $54,100 |
| 2021 | $3,402 | $79,510 | $25,410 | $54,100 |
| 2020 | $3,345 | $79,510 | $25,410 | $54,100 |
| 2019 | $3,305 | $79,510 | $25,410 | $54,100 |
| 2018 | $3,228 | $79,510 | $25,410 | $54,100 |
| 2017 | $3,177 | $79,510 | $25,410 | $54,100 |
| 2016 | $315 | $79,510 | $25,410 | $54,100 |
| 2015 | $315 | $79,510 | $25,410 | $54,100 |
| 2014 | $315 | $79,510 | $25,410 | $54,100 |
Source: Public Records
Map
Nearby Homes
- 602 D St
- 621 Magnolia Ct
- 631 Magnolia Ct
- 607 W Mulberry St
- 619 W Mulberry St
- 629 W Mulberry St
- 107 W State St
- 118 Austin Dr
- 126 Austin Dr
- 311 E State St
- 109 Chandler Mill Rd
- 612 Ridge Ave
- 115 Chandler Mill Rd
- 117 Chandler Mill Rd
- 114 Chandler Mill Rd
- 491 N Mill Rd
- 1261 Benjamin Dr
- 530 Richards Rd
- 406 Columbine Dr
- 535 Kenview Ave
Your Personal Tour Guide
Ask me questions while you tour the home.