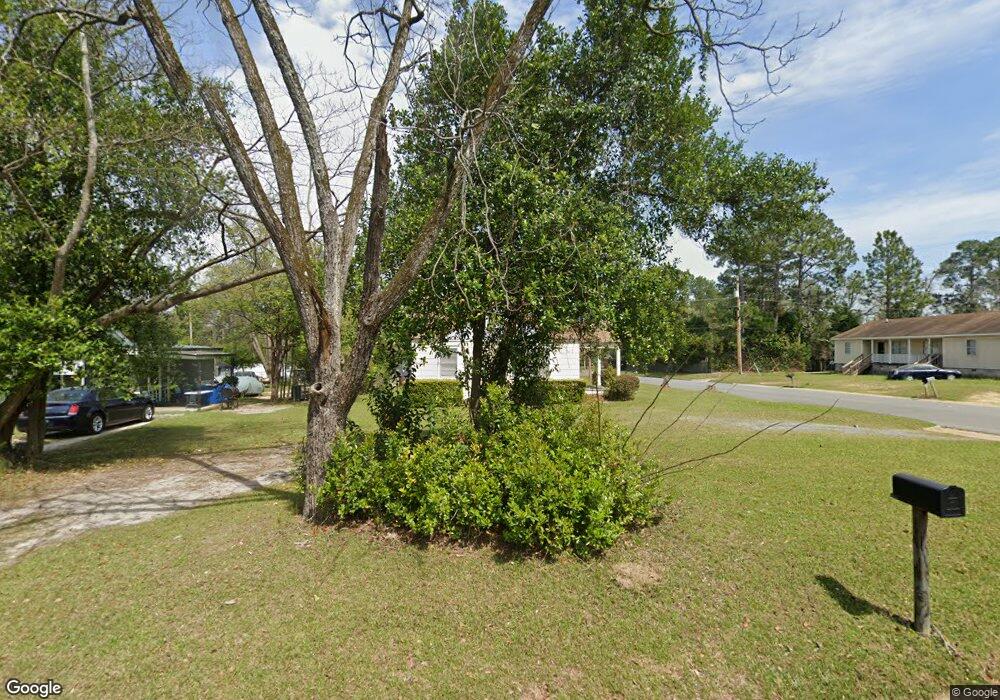
515 E 4th Ave Cordele, GA 31015
Estimated Value: $53,000 - $69,000
2
Beds
1
Bath
676
Sq Ft
$86/Sq Ft
Est. Value
About This Home
This home is located at 515 E 4th Ave, Cordele, GA 31015 and is currently estimated at $58,407, approximately $86 per square foot. 515 E 4th Ave is a home located in Crisp County with nearby schools including Crisp County Elementary School, Crisp County Primary School, and Crisp County Middle School.
Ownership History
Date
Name
Owned For
Owner Type
Purchase Details
Closed on
Sep 30, 2022
Sold by
Daniels & Daniels Properties Inc
Bought by
6 To 8 Properties Llc
Current Estimated Value
Purchase Details
Closed on
May 27, 2004
Sold by
Reynolds Hrant Henry Jr Estat
Bought by
Daniels & Daniels Properties
Purchase Details
Closed on
Aug 7, 2003
Sold by
Reynolds Grant H
Bought by
Reynolds Hrant Henry Jr Estate
Purchase Details
Closed on
Apr 22, 2001
Sold by
Reynolds Grant H
Bought by
Reynolds Grant H
Purchase Details
Closed on
Feb 2, 2000
Sold by
Reynolds Grant H
Bought by
Reynolds Grant H
Purchase Details
Closed on
Oct 14, 1994
Bought by
Reynolds Grant H
Purchase Details
Closed on
May 10, 1993
Bought by
Rainey Buford
Purchase Details
Closed on
Jan 15, 1992
Bought by
Yawn Charles Edward
Purchase Details
Closed on
Feb 28, 1985
Bought by
Yawn Maude S
Create a Home Valuation Report for This Property
The Home Valuation Report is an in-depth analysis detailing your home's value as well as a comparison with similar homes in the area
Purchase History
| Date | Buyer | Sale Price | Title Company |
|---|---|---|---|
| 6 To 8 Properties Llc | $39,500 | -- | |
| Daniels & Daniels Properties | $41,000 | -- | |
| Reynolds Hrant Henry Jr Estate | -- | -- | |
| Reynolds Grant H | -- | -- | |
| Reynolds Grant H | -- | -- | |
| Reynolds Grant H | $27,000 | -- | |
| Rainey Buford | $25,500 | -- | |
| Yawn Charles Edward | -- | -- | |
| Yawn Maude S | $12,500 | -- |
Source: Public Records
Tax History
| Year | Tax Paid | Tax Assessment Tax Assessment Total Assessment is a certain percentage of the fair market value that is determined by local assessors to be the total taxable value of land and additions on the property. | Land | Improvement |
|---|---|---|---|---|
| 2025 | $349 | $9,902 | $1,580 | $8,322 |
| 2024 | $329 | $9,174 | $1,580 | $7,594 |
| 2023 | $333 | $8,892 | $1,580 | $7,312 |
| 2022 | $225 | $8,528 | $1,580 | $6,948 |
| 2021 | $221 | $8,164 | $1,580 | $6,584 |
| 2020 | $230 | $8,164 | $1,580 | $6,584 |
| 2019 | $232 | $8,164 | $1,580 | $6,584 |
| 2018 | $217 | $7,377 | $2,370 | $5,007 |
| 2017 | $300 | $7,377 | $2,370 | $5,007 |
| 2016 | $218 | $7,377 | $2,370 | $5,007 |
| 2015 | -- | $7,377 | $2,370 | $5,007 |
| 2014 | -- | $7,377 | $2,370 | $5,007 |
| 2013 | -- | $7,377 | $2,370 | $5,007 |
Source: Public Records
Map
Nearby Homes
Your Personal Tour Guide
Ask me questions while you tour the home.