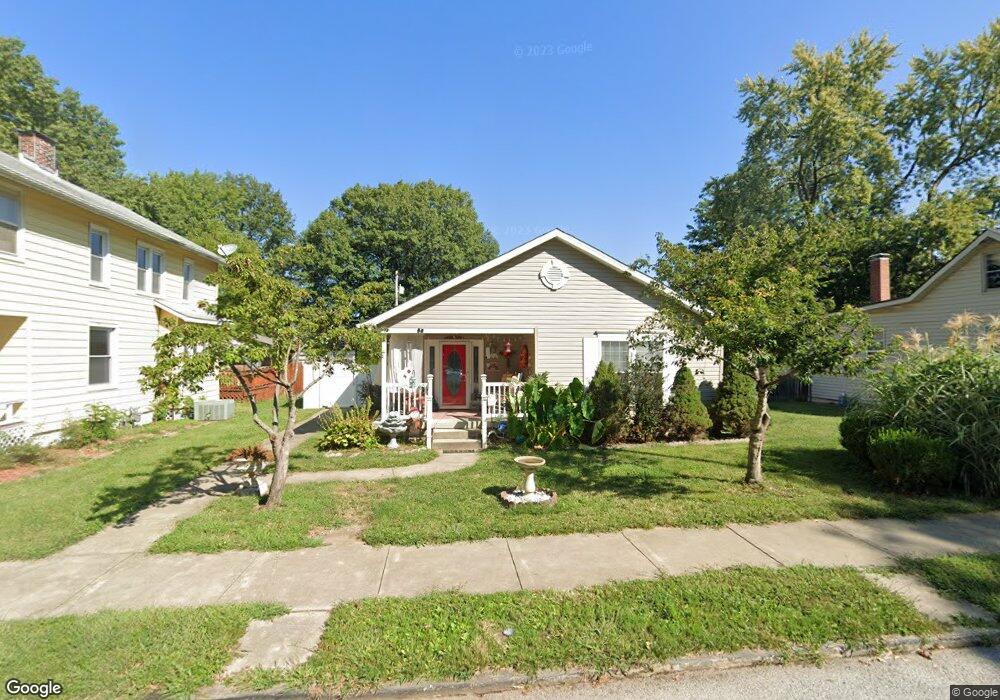
515 E C St Belleville, IL 62220
Estimated Value: $193,237 - $203,000
Studio
--
Bath
1,940
Sq Ft
$102/Sq Ft
Est. Value
About This Home
This home is located at 515 E C St, Belleville, IL 62220 and is currently estimated at $198,309, approximately $102 per square foot. 515 E C St is a home located in St. Clair County with nearby schools including Douglas Elementary School, Central Jr High School, and Governor French Academy.
Ownership History
Date
Name
Owned For
Owner Type
Purchase Details
Closed on
Sep 28, 2017
Sold by
Kronenberger Ronald J and Kronenberger Alvina
Bought by
Kronenberger Ronald J and Kronenberger Pamela Sue
Current Estimated Value
Home Financials for this Owner
Home Financials are based on the most recent Mortgage that was taken out on this home.
Original Mortgage
$159,116
Interest Rate
4.12%
Mortgage Type
FHA
Purchase Details
Closed on
Oct 19, 2004
Sold by
Kronenberger Ronald J
Bought by
Kronenberger Ronald J and Kronenberger Alvina
Home Financials for this Owner
Home Financials are based on the most recent Mortgage that was taken out on this home.
Original Mortgage
$100,700
Interest Rate
5%
Mortgage Type
Construction
Purchase Details
Closed on
Sep 27, 2002
Sold by
Kronenberger Alvina
Bought by
Kronenberger Ronald J
Create a Home Valuation Report for This Property
The Home Valuation Report is an in-depth analysis detailing your home's value as well as a comparison with similar homes in the area
Home Values in the Area
Average Home Value in this Area
Purchase History
| Date | Buyer | Sale Price | Title Company |
|---|---|---|---|
| Kronenberger Ronald J | -- | Title Star Agency Llc | |
| Kronenberger Ronald J | -- | Benchmark Title Company Llc | |
| Kronenberger Ronald J | -- | -- |
Source: Public Records
Mortgage History
| Date | Status | Borrower | Loan Amount |
|---|---|---|---|
| Closed | Kronenberger Ronald J | $159,116 | |
| Closed | Kronenberger Ronald J | $100,700 |
Source: Public Records
Tax History
| Year | Tax Paid | Tax Assessment Tax Assessment Total Assessment is a certain percentage of the fair market value that is determined by local assessors to be the total taxable value of land and additions on the property. | Land | Improvement |
|---|---|---|---|---|
| 2024 | $2,941 | $51,064 | $4,324 | $46,740 |
| 2023 | $3,140 | $53,406 | $4,238 | $49,168 |
| 2022 | $3,201 | $48,079 | $3,815 | $44,264 |
| 2021 | $3,335 | $44,448 | $3,527 | $40,921 |
| 2020 | $3,195 | $42,034 | $3,336 | $38,698 |
| 2019 | $3,089 | $40,814 | $3,341 | $37,473 |
| 2018 | $2,996 | $39,932 | $3,269 | $36,663 |
| 2017 | $2,975 | $39,651 | $3,246 | $36,405 |
| 2016 | $2,927 | $38,809 | $3,177 | $35,632 |
| 2014 | $2,588 | $38,986 | $3,055 | $35,931 |
| 2013 | $2,735 | $39,544 | $3,099 | $36,445 |
Source: Public Records
Map
Nearby Homes
- 521 E A St
- 8 Kircher Place
- 511 E Main St
- 513 N Jackson St
- 709 Benton St
- 219 N High St
- 30 Grand Ave
- 124 N Virginia Ave
- 212 Abend St
- 3 Wabash Place
- 508 Lebanon Ave
- 919 E Monroe St
- 111 W C St
- 222 S Jackson St
- 107 Wabash Ave
- 312 S Jackson St
- 402 Abend St
- 221 N 2nd St
- 1227 E B St Unit 1227/1229
- 526 Forest Ave
Your Personal Tour Guide
Ask me questions while you tour the home.