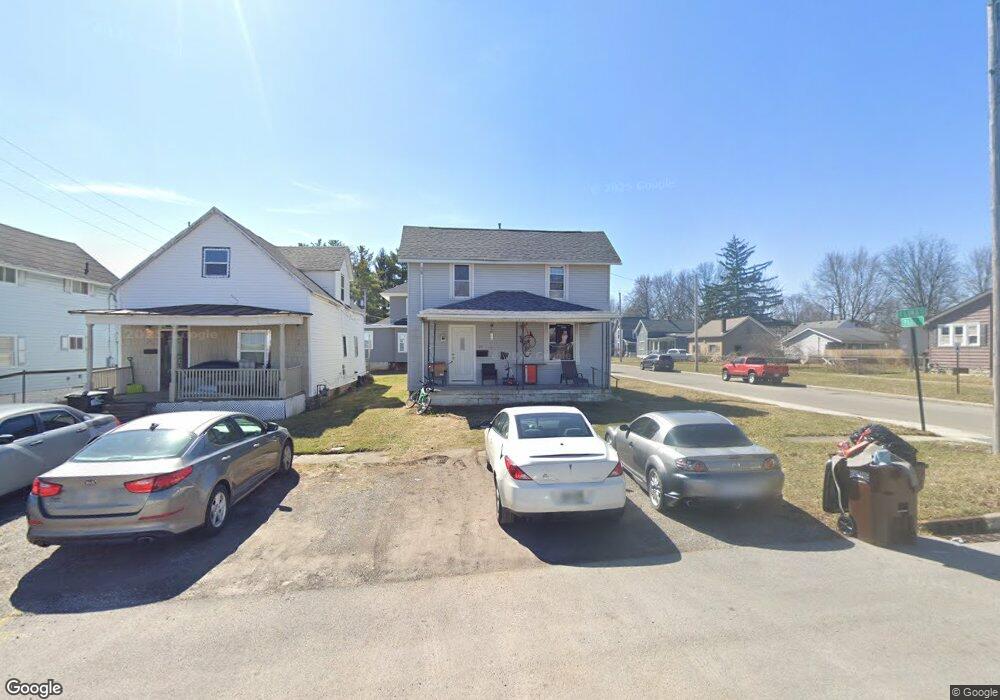
515 E Lima St Findlay, OH 45840
Estimated Value: $137,000 - $189,000
3
Beds
1
Bath
1,982
Sq Ft
$82/Sq Ft
Est. Value
About This Home
This home is located at 515 E Lima St, Findlay, OH 45840 and is currently estimated at $161,675, approximately $81 per square foot. 515 E Lima St is a home located in Hancock County with nearby schools including Lincoln Elementary School, Donnell Middle School, and Findlay High School.
Ownership History
Date
Name
Owned For
Owner Type
Purchase Details
Closed on
Oct 6, 2014
Sold by
Aka Property Of Findlay Llc
Bought by
Reiter Holdings Llc
Current Estimated Value
Purchase Details
Closed on
Aug 17, 2011
Sold by
Alge Jason M and Alge Amanda Kay
Bought by
Property Of Findlay Llc
Purchase Details
Closed on
Nov 18, 2010
Sold by
Driesbaugh Robert M
Bought by
Citimortgage Inc
Purchase Details
Closed on
Oct 1, 2010
Sold by
Citimortgage Inc
Bought by
The Secretary Of Housing & Urban Develop
Purchase Details
Closed on
May 20, 2005
Sold by
Edinger Joseph F and Edinger Linda S
Bought by
Driesbaugh Robert M and Driesbaugh Leslie W
Home Financials for this Owner
Home Financials are based on the most recent Mortgage that was taken out on this home.
Original Mortgage
$78,850
Interest Rate
9.55%
Mortgage Type
Purchase Money Mortgage
Create a Home Valuation Report for This Property
The Home Valuation Report is an in-depth analysis detailing your home's value as well as a comparison with similar homes in the area
Home Values in the Area
Average Home Value in this Area
Purchase History
| Date | Buyer | Sale Price | Title Company |
|---|---|---|---|
| Reiter Holdings Llc | $44,000 | Legacy Title | |
| Property Of Findlay Llc | -- | Assured Title Agency | |
| Citimortgage Inc | $25,667 | None Available | |
| The Secretary Of Housing & Urban Develop | -- | Attorney | |
| Driesbaugh Robert M | $70,000 | Golden Key Title |
Source: Public Records
Mortgage History
| Date | Status | Borrower | Loan Amount |
|---|---|---|---|
| Previous Owner | Driesbaugh Robert M | $78,850 |
Source: Public Records
Tax History
| Year | Tax Paid | Tax Assessment Tax Assessment Total Assessment is a certain percentage of the fair market value that is determined by local assessors to be the total taxable value of land and additions on the property. | Land | Improvement |
|---|---|---|---|---|
| 2024 | $1,358 | $37,250 | $3,130 | $34,120 |
| 2023 | $1,360 | $37,250 | $3,130 | $34,120 |
| 2022 | $1,355 | $37,250 | $3,130 | $34,120 |
| 2021 | $1,183 | $28,310 | $3,140 | $25,170 |
| 2020 | $1,182 | $28,310 | $3,140 | $25,170 |
| 2019 | $1,159 | $28,310 | $3,140 | $25,170 |
| 2018 | $1,100 | $24,610 | $2,730 | $21,880 |
| 2017 | $549 | $24,610 | $2,730 | $21,880 |
| 2016 | $1,094 | $24,610 | $2,730 | $21,880 |
| 2015 | $695 | $15,460 | $2,510 | $12,950 |
| 2014 | $695 | $15,460 | $2,510 | $12,950 |
| 2012 | $712 | $15,650 | $2,510 | $13,140 |
Source: Public Records
Map
Nearby Homes
- 829 Maple Ave
- 216 1st St
- 865 S Main St
- 623 E Sandusky St
- 815 Liberty St
- 514 Liberty St
- 123 Glendale Ave
- 15591 Canadian Way
- 15586 Canadian Way
- 15615 Canadian Way
- 206 Greenlawn Ave
- 412 Lima Ave
- 845 Hurd Ave
- 423 Elm St
- 860 Hurd Ave
- 731 5th St
- 1113 Hurd Ave
- 523 Center St
- 655 Clinton Ct
- 527 W Sandusky St
Your Personal Tour Guide
Ask me questions while you tour the home.