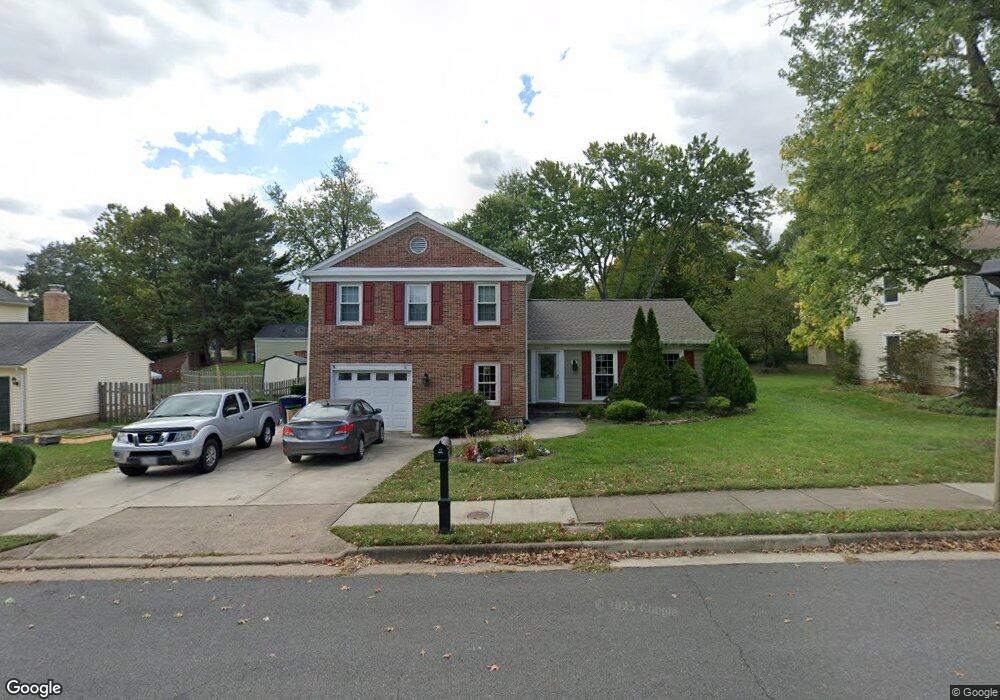
515 Fillmore St Herndon, VA 20170
Estimated Value: $698,177 - $757,000
4
Beds
3
Baths
1,500
Sq Ft
$491/Sq Ft
Est. Value
About This Home
This home is located at 515 Fillmore St, Herndon, VA 20170 and is currently estimated at $735,794, approximately $490 per square foot. 515 Fillmore St is a home located in Fairfax County with nearby schools including Herndon Elementary, Herndon Middle School, and Herndon High School.
Ownership History
Date
Name
Owned For
Owner Type
Purchase Details
Closed on
Aug 7, 2003
Sold by
Fall Steven R
Bought by
Liberatore Colleen O
Current Estimated Value
Home Financials for this Owner
Home Financials are based on the most recent Mortgage that was taken out on this home.
Original Mortgage
$287,200
Outstanding Balance
$123,336
Interest Rate
5.28%
Mortgage Type
New Conventional
Estimated Equity
$612,458
Purchase Details
Closed on
Feb 27, 2001
Sold by
Carrier Mark G
Bought by
Fall Steven R
Home Financials for this Owner
Home Financials are based on the most recent Mortgage that was taken out on this home.
Original Mortgage
$232,200
Interest Rate
7%
Purchase Details
Closed on
Dec 15, 2000
Sold by
Samuel I White P C
Bought by
Carrier Mark G
Purchase Details
Closed on
Jan 16, 1997
Sold by
Rutledge Gary S and Rutledge Mikki M
Bought by
Meline James F and Meline Loretta J
Home Financials for this Owner
Home Financials are based on the most recent Mortgage that was taken out on this home.
Original Mortgage
$158,650
Interest Rate
7.36%
Mortgage Type
New Conventional
Create a Home Valuation Report for This Property
The Home Valuation Report is an in-depth analysis detailing your home's value as well as a comparison with similar homes in the area
Home Values in the Area
Average Home Value in this Area
Purchase History
| Date | Buyer | Sale Price | Title Company |
|---|---|---|---|
| Liberatore Colleen O | $359,000 | -- | |
| Fall Steven R | $258,000 | -- | |
| Carrier Mark G | $184,000 | -- | |
| Meline James F | $167,000 | -- |
Source: Public Records
Mortgage History
| Date | Status | Borrower | Loan Amount |
|---|---|---|---|
| Open | Meline James F | $287,200 | |
| Previous Owner | Fall Steven R | $232,200 | |
| Previous Owner | Meline James F | $158,650 |
Source: Public Records
Tax History Compared to Growth
Tax History
| Year | Tax Paid | Tax Assessment Tax Assessment Total Assessment is a certain percentage of the fair market value that is determined by local assessors to be the total taxable value of land and additions on the property. | Land | Improvement |
|---|---|---|---|---|
| 2025 | $8,836 | $631,320 | $255,000 | $376,320 |
| 2024 | $8,836 | $622,890 | $255,000 | $367,890 |
| 2023 | $7,770 | $559,630 | $230,000 | $329,630 |
| 2022 | $7,882 | $559,630 | $230,000 | $329,630 |
| 2021 | $5,743 | $489,370 | $210,000 | $279,370 |
| 2020 | $5,485 | $463,450 | $210,000 | $253,450 |
| 2019 | $5,024 | $424,480 | $199,000 | $225,480 |
| 2018 | $4,882 | $424,480 | $199,000 | $225,480 |
| 2017 | $5,021 | $432,430 | $199,000 | $233,430 |
| 2016 | $4,686 | $404,460 | $186,000 | $218,460 |
| 2015 | $4,656 | $417,220 | $192,000 | $225,220 |
| 2014 | $4,320 | $388,010 | $179,000 | $209,010 |
Source: Public Records
Map
Nearby Homes
- 838 Colvin Ct
- 409 Madison Manor Ct
- 1008 Windcroft Glen Ct
- 402 Reneau Way
- 349 Reneau Way
- 604 Worchester St
- 1012 Grant St
- 108 Monroe Mills Ln
- 879 Station St
- 702 Elden St Unit B
- 12028 Walnut Branch Rd
- 401 Cavendish St
- 678 Old Hunt Way
- 1610 Sierra Woods Dr
- 1690 Sierra Woods Ct
- 220 Herndon Station Square
- 978 Branch Dr
- 802 Vine St
- 1029 Kings Ct
- 1617 Purple Sage Dr
- 517 Fillmore St
- 513 Fillmore St
- 847 Colvin Ct
- 849 Colvin Ct
- 519 Fillmore St
- 514 Fillmore St
- 845 Colvin Ct
- 851 Colvin Ct
- 516 Fillmore St
- 521 Fillmore St
- 518 Fillmore St
- 520 Fillmore St
- 850 Colvin Ct
- 511 Fillmore St
- 846 Colvin Ct
- 510 Fillmore St
- 848 Colvin Ct
- 844 Colvin Ct
- 523 Fillmore St
- 518 Dranesville Rd