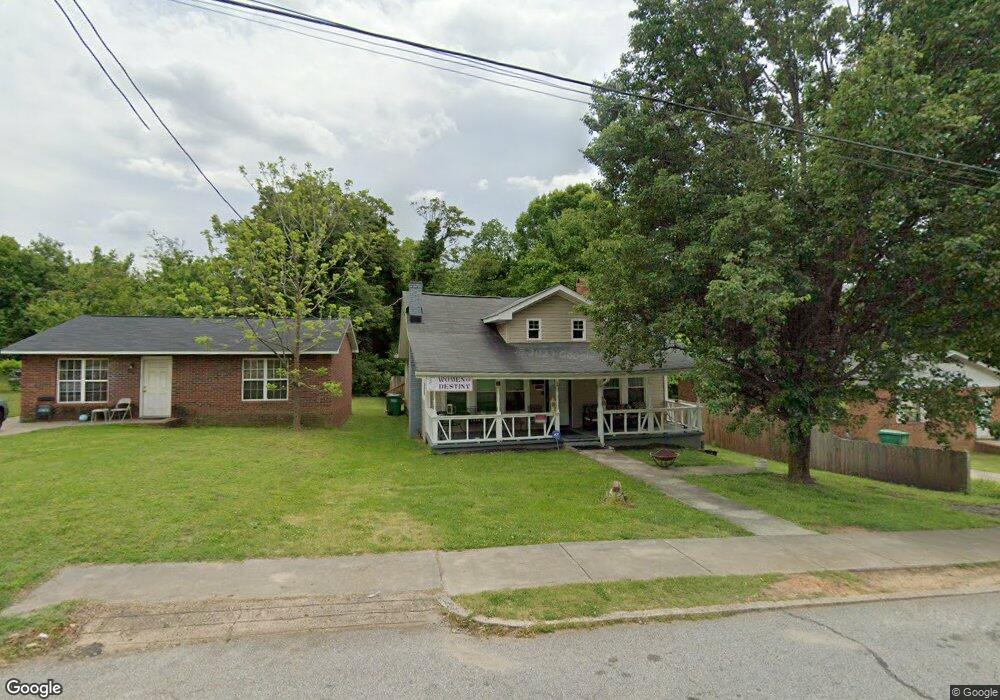
515 Flint Ave High Point, NC 27260
Greater High Point NeighborhoodEstimated Value: $89,056 - $222,000
2
Beds
1
Bath
1,204
Sq Ft
$123/Sq Ft
Est. Value
About This Home
This home is located at 515 Flint Ave, High Point, NC 27260 and is currently estimated at $147,764, approximately $122 per square foot. 515 Flint Ave is a home located in Guilford County with nearby schools including Oak Hill Elementary School, Ferndale Middle School, and High Point Central High School.
Ownership History
Date
Name
Owned For
Owner Type
Purchase Details
Closed on
Jun 24, 2016
Sold by
Smith Golden Melodie and Golden Eugene
Bought by
Smith Properties & Development Llc
Current Estimated Value
Purchase Details
Closed on
Jul 12, 2013
Sold by
Alsac St Jude Childrens Research Hospita
Bought by
Smith Golden Melodie
Purchase Details
Closed on
Sep 8, 1980
Bought by
St Jude Children'S Research Hospital
Create a Home Valuation Report for This Property
The Home Valuation Report is an in-depth analysis detailing your home's value as well as a comparison with similar homes in the area
Home Values in the Area
Average Home Value in this Area
Purchase History
| Date | Buyer | Sale Price | Title Company |
|---|---|---|---|
| Smith Properties & Development Llc | -- | None Available | |
| Smith Golden Melodie | $9,000 | None Available | |
| St Jude Children'S Research Hospital | $11,500 | -- |
Source: Public Records
Tax History
| Year | Tax Paid | Tax Assessment Tax Assessment Total Assessment is a certain percentage of the fair market value that is determined by local assessors to be the total taxable value of land and additions on the property. | Land | Improvement |
|---|---|---|---|---|
| 2025 | $613 | $44,500 | $7,000 | $37,500 |
| 2024 | $613 | $44,500 | $7,000 | $37,500 |
| 2023 | $613 | $44,500 | $7,000 | $37,500 |
| 2022 | $600 | $44,500 | $7,000 | $37,500 |
| 2021 | $400 | $29,000 | $6,500 | $22,500 |
| 2020 | $400 | $29,000 | $6,500 | $22,500 |
| 2019 | $400 | $29,000 | $0 | $0 |
| 2018 | $398 | $29,000 | $0 | $0 |
| 2017 | $398 | $29,000 | $0 | $0 |
| 2016 | $432 | $30,800 | $0 | $0 |
| 2015 | $434 | $30,800 | $0 | $0 |
| 2014 | $442 | $30,800 | $0 | $0 |
Source: Public Records
Map
Nearby Homes
- 308 W Kearns Ave
- 537 Flint Ave
- 1213 S Elm St
- 405 W Willis Ave
- 407 W Willis Ave
- 1217 Cloverdale St
- 323 Coltrane Ave
- 1410 Cloverdale St
- 1504 Cloverdale St
- 616 S Elm St
- 4304 Griffins Gate Ln
- 816 Tryon Ave
- 812 Tryon Ave
- 703 Langford Ave
- 604 W Ward Ave
- 527 Amos St
- 525 Amos St
- 328 Ennis St
- 1603 Connor Place
- 1015 Sharon St
Your Personal Tour Guide
Ask me questions while you tour the home.