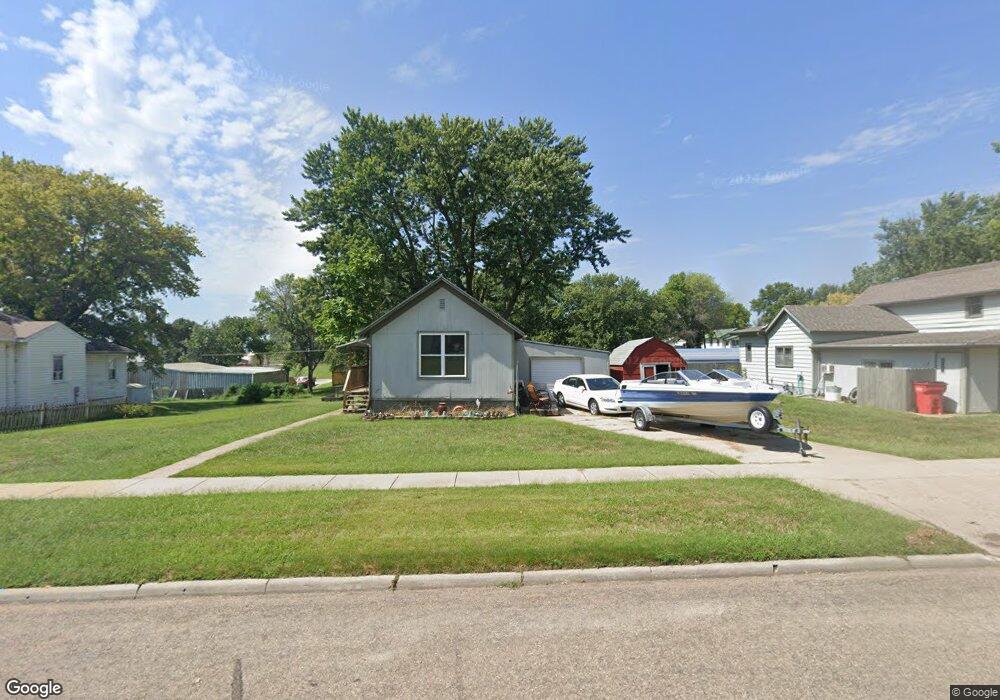
515 Fulton St Falls City, NE 68355
Estimated Value: $49,000 - $69,000
1
Bed
1
Bath
540
Sq Ft
$111/Sq Ft
Est. Value
About This Home
This home is located at 515 Fulton St, Falls City, NE 68355 and is currently estimated at $60,187, approximately $111 per square foot. 515 Fulton St is a home located in Richardson County with nearby schools including Falls City North Elementary School, Falls City South Elementary School, and Falls City Middle School.
Ownership History
Date
Name
Owned For
Owner Type
Purchase Details
Closed on
May 16, 2013
Sold by
Davis Ron
Bought by
Cook Vicotria L
Current Estimated Value
Purchase Details
Closed on
Dec 9, 2009
Sold by
Beckner Kevin E
Bought by
Witt Robert J and Witt Tammy K
Purchase Details
Closed on
Jan 23, 2009
Sold by
Mccartney Jr Russell
Bought by
Beckner Kevin E
Purchase Details
Closed on
Feb 15, 2008
Sold by
Wendtlandt Michele
Bought by
Mccartney Jr Russell
Purchase Details
Closed on
Aug 15, 2003
Sold by
Wendtlandt Henry F and Wendtlandt Jean Donald
Bought by
Wendtlandt Michele
Create a Home Valuation Report for This Property
The Home Valuation Report is an in-depth analysis detailing your home's value as well as a comparison with similar homes in the area
Home Values in the Area
Average Home Value in this Area
Purchase History
| Date | Buyer | Sale Price | Title Company |
|---|---|---|---|
| Cook Vicotria L | -- | -- | |
| Witt Robert J | $5,500 | -- | |
| Beckner Kevin E | $5,500 | -- | |
| Mccartney Jr Russell | $5,000 | -- | |
| Wendtlandt Michele | -- | -- |
Source: Public Records
Tax History Compared to Growth
Tax History
| Year | Tax Paid | Tax Assessment Tax Assessment Total Assessment is a certain percentage of the fair market value that is determined by local assessors to be the total taxable value of land and additions on the property. | Land | Improvement |
|---|---|---|---|---|
| 2025 | $382 | $32,071 | $4,500 | $27,571 |
| 2024 | $382 | $30,510 | $4,500 | $26,010 |
| 2023 | $372 | $22,668 | $4,500 | $18,168 |
| 2022 | $399 | $20,770 | $3,240 | $17,530 |
| 2021 | $344 | $18,355 | $3,240 | $15,115 |
| 2020 | $334 | $17,635 | $3,240 | $14,395 |
| 2019 | $331 | $17,216 | $3,240 | $13,976 |
| 2018 | $327 | $16,809 | $3,240 | $13,569 |
| 2017 | $327 | $16,809 | $3,240 | $13,569 |
| 2016 | $318 | $16,414 | $3,240 | $13,174 |
| 2015 | $319 | $16,414 | $3,240 | $13,174 |
| 2014 | $319 | $16,414 | $3,240 | $13,174 |
Source: Public Records
Map
Nearby Homes