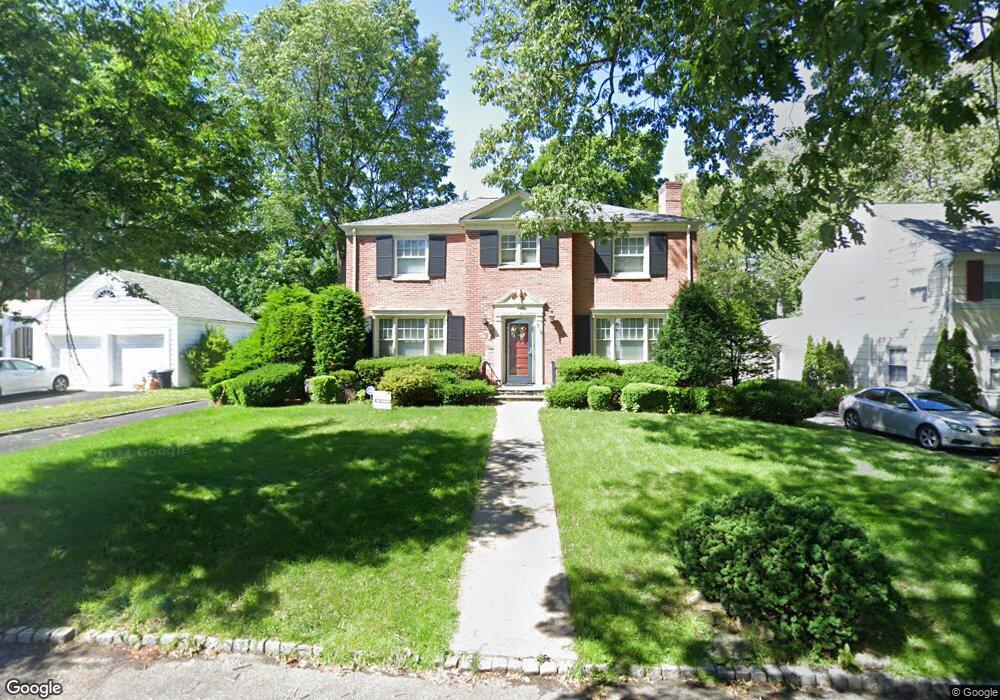
515 Hartford Ct South Orange, NJ 07079
Estimated Value: $953,000 - $1,289,000
--
Bed
--
Bath
2,929
Sq Ft
$382/Sq Ft
Est. Value
About This Home
This home is located at 515 Hartford Ct, South Orange, NJ 07079 and is currently estimated at $1,117,541, approximately $381 per square foot. 515 Hartford Ct is a home located in Essex County with nearby schools including Marshall Elementary School, South Orange Middle School, and Columbia Senior High School.
Ownership History
Date
Name
Owned For
Owner Type
Purchase Details
Closed on
Oct 16, 1996
Sold by
Swann Nancy
Bought by
Clanahan Kevin Lecount Mc and Clanahan Sonya Lecount Mc
Current Estimated Value
Home Financials for this Owner
Home Financials are based on the most recent Mortgage that was taken out on this home.
Original Mortgage
$166,000
Outstanding Balance
$15,106
Interest Rate
7.99%
Estimated Equity
$1,102,435
Create a Home Valuation Report for This Property
The Home Valuation Report is an in-depth analysis detailing your home's value as well as a comparison with similar homes in the area
Home Values in the Area
Average Home Value in this Area
Purchase History
| Date | Buyer | Sale Price | Title Company |
|---|---|---|---|
| Clanahan Kevin Lecount Mc | $184,000 | -- |
Source: Public Records
Mortgage History
| Date | Status | Borrower | Loan Amount |
|---|---|---|---|
| Open | Clanahan Kevin Lecount Mc | $166,000 |
Source: Public Records
Tax History Compared to Growth
Tax History
| Year | Tax Paid | Tax Assessment Tax Assessment Total Assessment is a certain percentage of the fair market value that is determined by local assessors to be the total taxable value of land and additions on the property. | Land | Improvement |
|---|---|---|---|---|
| 2025 | $20,051 | $978,700 | $377,400 | $601,300 |
| 2024 | $20,051 | $978,700 | $377,400 | $601,300 |
| 2022 | $19,334 | $551,300 | $289,400 | $261,900 |
| 2021 | $18,662 | $551,300 | $289,400 | $261,900 |
| 2020 | $18,083 | $551,300 | $289,400 | $261,900 |
| 2019 | $17,631 | $551,300 | $289,400 | $261,900 |
| 2018 | $17,366 | $551,300 | $289,400 | $261,900 |
| 2017 | $18,469 | $601,200 | $289,400 | $311,800 |
| 2016 | $16,147 | $421,800 | $202,000 | $219,800 |
| 2015 | $15,771 | $421,800 | $202,000 | $219,800 |
| 2014 | $18,488 | $505,000 | $246,400 | $258,600 |
Source: Public Records
Map
Nearby Homes
- 510 Finlay Place
- 129 Holland Rd
- 1 S Stanley Rd
- 743 Haxton Ave
- 11 S Stanley Rd
- 19 Dover St
- 733 Mosswood Ave
- 666 Tremont Ct
- 663 S Center St
- 335 Tremont Ave
- 316 Lawnridge Rd
- 362 Sanford Ave
- 281 Beechwood Terrace
- 32 Palm St
- 655 Mosswood Ave
- 117 Reynolds Place
- 143 Smith St
- 82 Palm St
- 85 Smith St
- 513 Sanford Ave