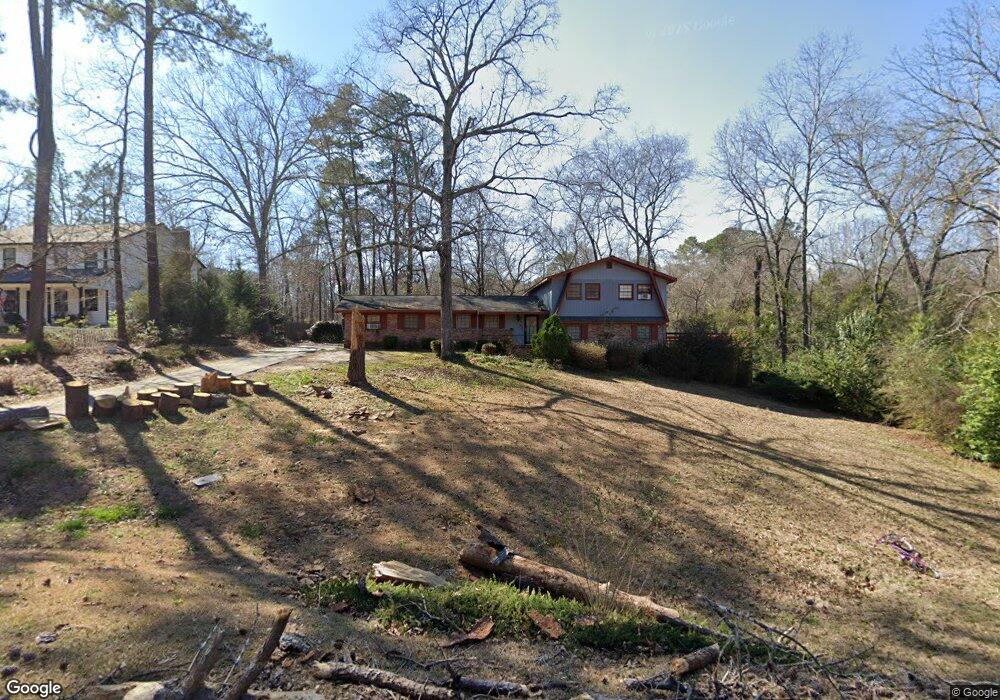
515 Heritage Dr Warner Robins, GA 31093
Estimated Value: $257,656 - $286,000
4
Beds
3
Baths
2,462
Sq Ft
$112/Sq Ft
Est. Value
About This Home
This home is located at 515 Heritage Dr, Warner Robins, GA 31093 and is currently estimated at $275,164, approximately $111 per square foot. 515 Heritage Dr is a home located in Houston County with nearby schools including Northside Elementary School, Northside Middle School, and Northside High School.
Ownership History
Date
Name
Owned For
Owner Type
Purchase Details
Closed on
Mar 27, 2020
Sold by
Porter Houston G
Bought by
Atkins Celeste
Current Estimated Value
Home Financials for this Owner
Home Financials are based on the most recent Mortgage that was taken out on this home.
Original Mortgage
$147,263
Outstanding Balance
$128,744
Interest Rate
3.4%
Mortgage Type
New Conventional
Estimated Equity
$146,420
Purchase Details
Closed on
Sep 17, 2010
Sold by
Porter Christine J
Bought by
Porter Houston G
Purchase Details
Closed on
Apr 16, 1997
Sold by
Porter Christine J
Bought by
Porter Houston G Jr & Christine J*
Purchase Details
Closed on
Sep 23, 1986
Sold by
Corrective Deed
Bought by
Porter Christine J
Purchase Details
Closed on
Jun 9, 1984
Sold by
Porter Houston G Jr
Bought by
Porter Christine J
Purchase Details
Closed on
Sep 16, 1977
Sold by
Hayden C Foster
Bought by
Porter Houston Jr & Christine J
Purchase Details
Closed on
May 2, 1977
Sold by
Wellston Constru Tion & Dev Co
Bought by
Hayden C Foster
Create a Home Valuation Report for This Property
The Home Valuation Report is an in-depth analysis detailing your home's value as well as a comparison with similar homes in the area
Home Values in the Area
Average Home Value in this Area
Purchase History
| Date | Buyer | Sale Price | Title Company |
|---|---|---|---|
| Atkins Celeste | $150,000 | None Available | |
| Porter Houston G | -- | None Available | |
| Porter Houston G Jr & Christine J* | -- | -- | |
| Porter Christine J | -- | -- | |
| Porter Christine J | -- | -- | |
| Porter Houston Jr & Christine J | -- | -- | |
| Hayden C Foster | -- | -- |
Source: Public Records
Mortgage History
| Date | Status | Borrower | Loan Amount |
|---|---|---|---|
| Open | Atkins Celeste | $147,263 |
Source: Public Records
Tax History
| Year | Tax Paid | Tax Assessment Tax Assessment Total Assessment is a certain percentage of the fair market value that is determined by local assessors to be the total taxable value of land and additions on the property. | Land | Improvement |
|---|---|---|---|---|
| 2025 | $2,083 | $95,360 | $8,640 | $86,720 |
| 2024 | $2,118 | $88,560 | $8,640 | $79,920 |
| 2023 | $1,859 | $76,920 | $8,640 | $68,280 |
| 2022 | $1,715 | $70,960 | $7,920 | $63,040 |
| 2021 | $1,458 | $60,200 | $7,920 | $52,280 |
| 2020 | $1,221 | $50,040 | $7,920 | $42,120 |
| 2019 | $1,221 | $50,040 | $7,920 | $42,120 |
| 2018 | $1,221 | $50,040 | $7,920 | $42,120 |
| 2017 | $1,223 | $50,040 | $7,920 | $42,120 |
| 2016 | $1,238 | $50,600 | $7,920 | $42,680 |
| 2015 | $1,241 | $50,600 | $7,920 | $42,680 |
| 2014 | -- | $50,600 | $7,920 | $42,680 |
| 2013 | -- | $51,040 | $7,920 | $43,120 |
Source: Public Records
Map
Nearby Homes
- 201 Custer Dr
- 103 Echeconnee Ridge Rd
- 203 River Birch Way
- 527 Sullivan Rd
- 110 Stonefield Ct
- 98 Waterfront Way
- 319 Air View Dr Unit 14
- 224 Highpoint Dr
- 501 Dunbar Rd
- 126 Waterfront Way
- 205 Scarborough Rd
- 136 Scarborough Rd
- 210 Webb St
- 106 Maple Glen Ct
- 213 Fairgrounds Blvd
- 60 Tiffany Ln
- 106 Scarborough Rd
- 111 Red Oak Glen
- 105 Maple Glen Ct
- 312 Hickory Glen
- 513 Heritage Dr
- 517 Heritage Dr
- 101 Van Dorn Ct
- 510 Heritage Dr
- 106 Pickett Ct
- 519 Heritage Dr
- 508 Heritage Dr
- 105 Pickett Ct
- 516 Heritage Dr
- 105 Van Dorn Ct
- 104 Pickett Ct
- 506 Heritage Dr
- 100 Van Dorn Ct
- 123 Augustus Dr
- 109 Patton Dr
- 103 Pickett Ct
- 107 Patton Dr
- 121 Augustus Dr
- 100 Pickett Ct
- 504 Heritage Dr
Your Personal Tour Guide
Ask me questions while you tour the home.