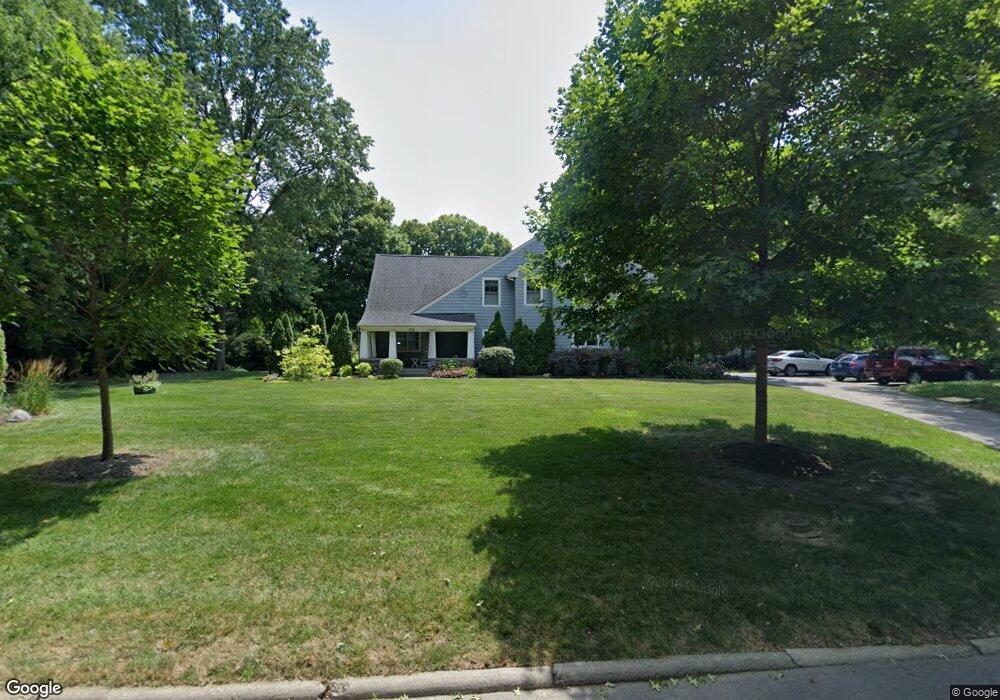
515 Hillcrest Rd West Lafayette, IN 47906
Estimated Value: $782,000 - $1,058,000
4
Beds
4
Baths
4,818
Sq Ft
$197/Sq Ft
Est. Value
About This Home
This home is located at 515 Hillcrest Rd, West Lafayette, IN 47906 and is currently estimated at $950,487, approximately $197 per square foot. 515 Hillcrest Rd is a home located in Tippecanoe County with nearby schools including West Lafayette Intermediate School, West Lafayette Elementary School, and West Lafayette Junior/Senior High School.
Ownership History
Date
Name
Owned For
Owner Type
Purchase Details
Closed on
Mar 30, 2007
Sold by
Truitt Randolph P and Truitt Krista D
Bought by
Virata Steven R and Kidd Gena R
Current Estimated Value
Home Financials for this Owner
Home Financials are based on the most recent Mortgage that was taken out on this home.
Original Mortgage
$534,400
Outstanding Balance
$324,886
Interest Rate
6.25%
Mortgage Type
Purchase Money Mortgage
Estimated Equity
$625,601
Purchase Details
Closed on
Jul 7, 2004
Sold by
Smith Margaret M and Haniford Margaret M
Bought by
Truitt Randolph P and Truitt Krista D
Purchase Details
Closed on
Jul 6, 2004
Sold by
Haniford David W
Bought by
Truitt Randolph P and Truitt Krista D
Create a Home Valuation Report for This Property
The Home Valuation Report is an in-depth analysis detailing your home's value as well as a comparison with similar homes in the area
Home Values in the Area
Average Home Value in this Area
Purchase History
| Date | Buyer | Sale Price | Title Company |
|---|---|---|---|
| Virata Steven R | -- | None Available | |
| Truitt Randolph P | -- | -- | |
| Truitt Randolph P | -- | -- |
Source: Public Records
Mortgage History
| Date | Status | Borrower | Loan Amount |
|---|---|---|---|
| Open | Virata Steven R | $534,400 |
Source: Public Records
Tax History Compared to Growth
Tax History
| Year | Tax Paid | Tax Assessment Tax Assessment Total Assessment is a certain percentage of the fair market value that is determined by local assessors to be the total taxable value of land and additions on the property. | Land | Improvement |
|---|---|---|---|---|
| 2024 | $10,296 | $839,500 | $127,300 | $712,200 |
| 2023 | $9,826 | $796,000 | $127,300 | $668,700 |
| 2022 | $8,630 | $694,700 | $127,300 | $567,400 |
| 2021 | $9,678 | $776,100 | $80,000 | $696,100 |
| 2020 | $9,222 | $740,200 | $80,000 | $660,200 |
| 2019 | $8,953 | $719,300 | $80,000 | $639,300 |
| 2018 | $9,312 | $738,000 | $96,200 | $641,800 |
| 2017 | $9,020 | $716,300 | $96,200 | $620,100 |
| 2016 | $9,194 | $730,400 | $96,200 | $634,200 |
| 2014 | $8,285 | $669,000 | $96,200 | $572,800 |
| 2013 | $6,199 | $497,400 | $74,100 | $423,300 |
Source: Public Records
Map
Nearby Homes
- 509 Carrolton Blvd
- 500 Carrolton Blvd
- 701 Carrolton Blvd
- 1220 Ravinia Rd
- 1912 Indian Trail Dr
- 231 Schilling St
- 2212 Sycamore Ln
- 1201 Lindberg Rd
- 416 Catherwood Dr
- 2306 Carmel Dr
- 845 Rose St
- 106 W Navajo St
- 516 Robinson St
- 1868 N River Rd
- 1190 Camelback Blvd
- 631 Kent Ave
- 624 Kent Ave
- 448 Westview Cir
- 2801 Henderson St
- 320 Brown St
- 1424 Ravinia Rd
- 1420 Ravinia Rd
- 507 Hillcrest Rd
- 518 Hillcrest Rd
- 512 Hillcrest Rd
- 1414 Ravinia Rd
- 1415 N Grant St
- 1500 Ravinia Rd
- 508 Hillcrest Rd
- 501 Hillcrest Rd
- 1419 Ravinia Rd
- 1425 Ravinia Rd
- 1415 Ravinia Rd
- 1501 Ravinia Rd
- 515 Carrolton Blvd
- 527 Carrolton Blvd
- 1603 N Grant St
- 531 Carrolton Blvd
- 1400 Ravinia Rd
- 1407 N Grant St