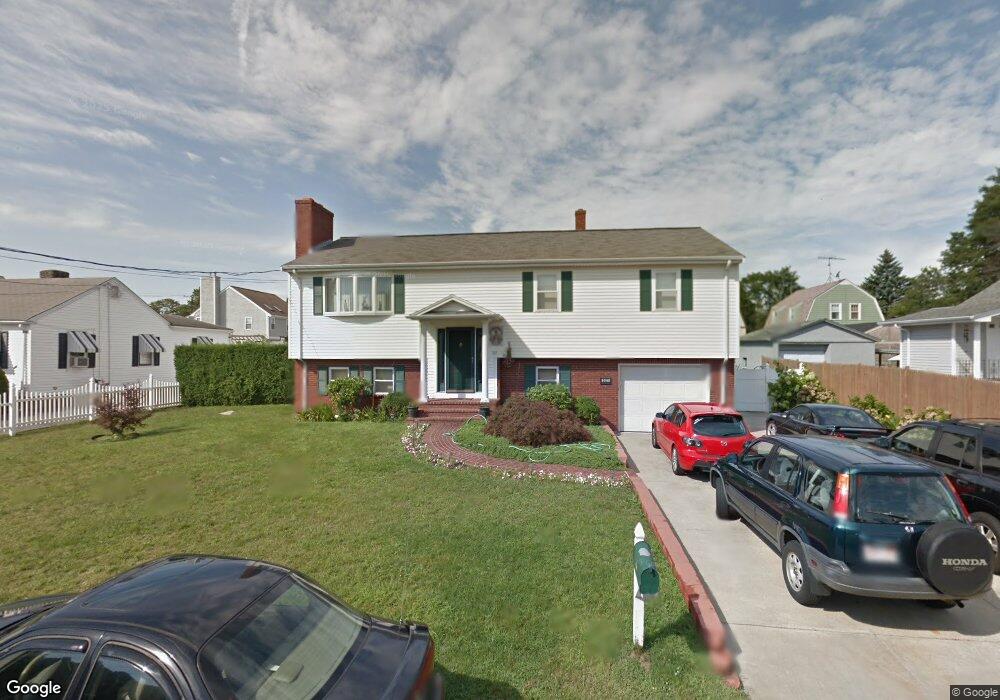
515 John St New Bedford, MA 02740
Buttonwood Park NeighborhoodEstimated Value: $527,087 - $553,000
3
Beds
3
Baths
2,113
Sq Ft
$254/Sq Ft
Est. Value
About This Home
This home is located at 515 John St, New Bedford, MA 02740 and is currently estimated at $537,522, approximately $254 per square foot. 515 John St is a home located in Bristol County with nearby schools including Betsey B. Winslow Elementary School, Keith Middle School, and New Bedford High School.
Ownership History
Date
Name
Owned For
Owner Type
Purchase Details
Closed on
Oct 11, 2005
Sold by
Medeiros Michael and Caneira Paula C
Bought by
Camara Helder F
Current Estimated Value
Home Financials for this Owner
Home Financials are based on the most recent Mortgage that was taken out on this home.
Original Mortgage
$249,000
Interest Rate
5.81%
Mortgage Type
Purchase Money Mortgage
Purchase Details
Closed on
Feb 1, 1993
Sold by
Pereira Adelaide
Bought by
Medeiros Michael
Create a Home Valuation Report for This Property
The Home Valuation Report is an in-depth analysis detailing your home's value as well as a comparison with similar homes in the area
Home Values in the Area
Average Home Value in this Area
Purchase History
| Date | Buyer | Sale Price | Title Company |
|---|---|---|---|
| Camara Helder F | $340,000 | -- | |
| Camara Helder F | $340,000 | -- | |
| Medeiros Michael | $10,995 | -- | |
| Medeiros Michael | $10,995 | -- |
Source: Public Records
Mortgage History
| Date | Status | Borrower | Loan Amount |
|---|---|---|---|
| Previous Owner | Medeiros Michael | $227,000 | |
| Previous Owner | Medeiros Michael | $249,000 |
Source: Public Records
Tax History Compared to Growth
Tax History
| Year | Tax Paid | Tax Assessment Tax Assessment Total Assessment is a certain percentage of the fair market value that is determined by local assessors to be the total taxable value of land and additions on the property. | Land | Improvement |
|---|---|---|---|---|
| 2025 | $5,163 | $456,500 | $124,900 | $331,600 |
| 2024 | $5,071 | $422,600 | $119,000 | $303,600 |
| 2023 | $5,695 | $398,500 | $106,600 | $291,900 |
| 2022 | $5,296 | $340,800 | $101,500 | $239,300 |
| 2021 | $5,050 | $323,900 | $101,500 | $222,400 |
| 2020 | $5,045 | $312,200 | $105,400 | $206,800 |
| 2019 | $4,990 | $303,000 | $107,300 | $195,700 |
| 2018 | $4,814 | $289,500 | $107,300 | $182,200 |
| 2017 | $4,590 | $275,000 | $107,300 | $167,700 |
| 2016 | $4,296 | $260,500 | $101,500 | $159,000 |
| 2015 | $4,055 | $257,800 | $105,400 | $152,400 |
| 2014 | $3,910 | $257,900 | $107,300 | $150,600 |
Source: Public Records
Map
Nearby Homes