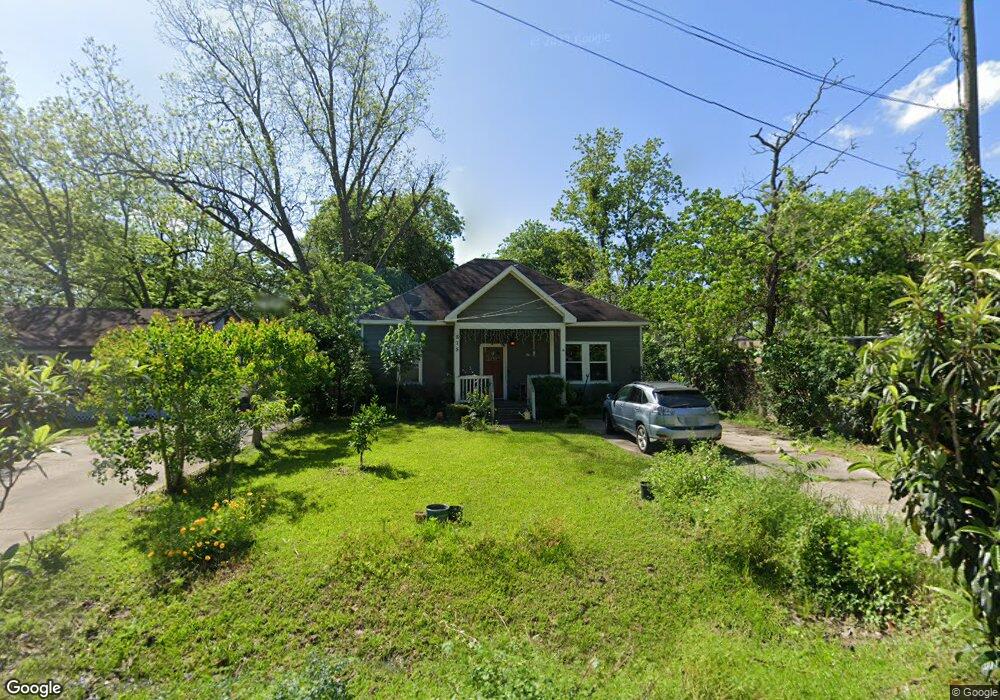
515 Kane St Tomball, TX 77375
Estimated Value: $284,752 - $325,000
3
Beds
1
Bath
1,230
Sq Ft
$246/Sq Ft
Est. Value
About This Home
This home is located at 515 Kane St, Tomball, TX 77375 and is currently estimated at $302,438, approximately $245 per square foot. 515 Kane St is a home located in Harris County with nearby schools including Tomball Elementary School, Tomball Intermediate School, and Tomball Junior High School.
Ownership History
Date
Name
Owned For
Owner Type
Purchase Details
Closed on
Mar 3, 2017
Sold by
Honeck Robert L and Honeck Jennifer M
Bought by
Mera Esther and Reed John
Current Estimated Value
Purchase Details
Closed on
Aug 18, 2014
Sold by
J Scott Holmes Iv 401K Plan and Holmes J
Bought by
Honeck Robert L and Honeck Jennifer M
Home Financials for this Owner
Home Financials are based on the most recent Mortgage that was taken out on this home.
Original Mortgage
$101,740
Interest Rate
4.16%
Mortgage Type
New Conventional
Purchase Details
Closed on
Aug 24, 2012
Sold by
Rv Holdings Nine Llc
Bought by
J Scott Holmes Iv 401K Plan and Holmes
Purchase Details
Closed on
Mar 22, 2012
Sold by
Federal National Mortgage Association
Bought by
Rv Holdings Nine Llc
Purchase Details
Closed on
Jul 5, 2011
Sold by
Wilson Cecil E and Wilson Dorothy
Bought by
Federal National Mortgage Association
Create a Home Valuation Report for This Property
The Home Valuation Report is an in-depth analysis detailing your home's value as well as a comparison with similar homes in the area
Home Values in the Area
Average Home Value in this Area
Purchase History
| Date | Buyer | Sale Price | Title Company |
|---|---|---|---|
| Mera Esther | -- | None Available | |
| Honeck Robert L | -- | American Title Company | |
| Honeck Robert L | -- | American Title Company | |
| J Scott Holmes Iv 401K Plan | -- | American Title Company | |
| J Scott Holmes Iv 401K Plan | -- | American Title Company | |
| Rv Holdings Nine Llc | -- | Chicago Title Ins Co | |
| Federal National Mortgage Association | $55,122 | None Available |
Source: Public Records
Mortgage History
| Date | Status | Borrower | Loan Amount |
|---|---|---|---|
| Previous Owner | Honeck Robert L | $101,740 |
Source: Public Records
Tax History
| Year | Tax Paid | Tax Assessment Tax Assessment Total Assessment is a certain percentage of the fair market value that is determined by local assessors to be the total taxable value of land and additions on the property. | Land | Improvement |
|---|---|---|---|---|
| 2025 | $5,954 | $303,284 | $105,000 | $198,284 |
| 2024 | $5,954 | $269,000 | $98,000 | $171,000 |
| 2023 | $5,954 | $261,751 | $84,000 | $177,751 |
| 2022 | $4,825 | $212,900 | $63,000 | $149,900 |
| 2021 | $3,779 | $159,350 | $45,500 | $113,850 |
| 2020 | $4,081 | $166,373 | $35,000 | $131,373 |
| 2019 | $4,198 | $166,407 | $28,000 | $138,407 |
| 2018 | $2,453 | $183,039 | $28,000 | $155,039 |
| 2017 | $4,612 | $183,039 | $28,000 | $155,039 |
| 2016 | $4,267 | $169,326 | $28,000 | $141,326 |
| 2015 | $2,531 | $166,130 | $28,000 | $138,130 |
| 2014 | $2,531 | $99,448 | $28,000 | $71,448 |
Source: Public Records
Map
Nearby Homes
- 302 Epps St
- 18818 Cornelia Fields Ln
- 18723 Buttercup Farms Ln
- 2235 Cold Stream Ln
- 19935 Epona Creek Dr
- 18707 Buttercup Farms Ln
- 18826 Cornelia Fields Ln
- 701 Malone St
- 508 Clarence St
- 200 S Cherry St
- 712 Clarence St
- 504 Percival St Unit A
- 614 Percival St
- 204 Vernon St
- 702 Clayton St
- TBD Clayton St
- 0 N Sycamore St
- 200 S Vernon St
- 0 Mcphail St Unit 80368221
- 410 N Peach St
Your Personal Tour Guide
Ask me questions while you tour the home.