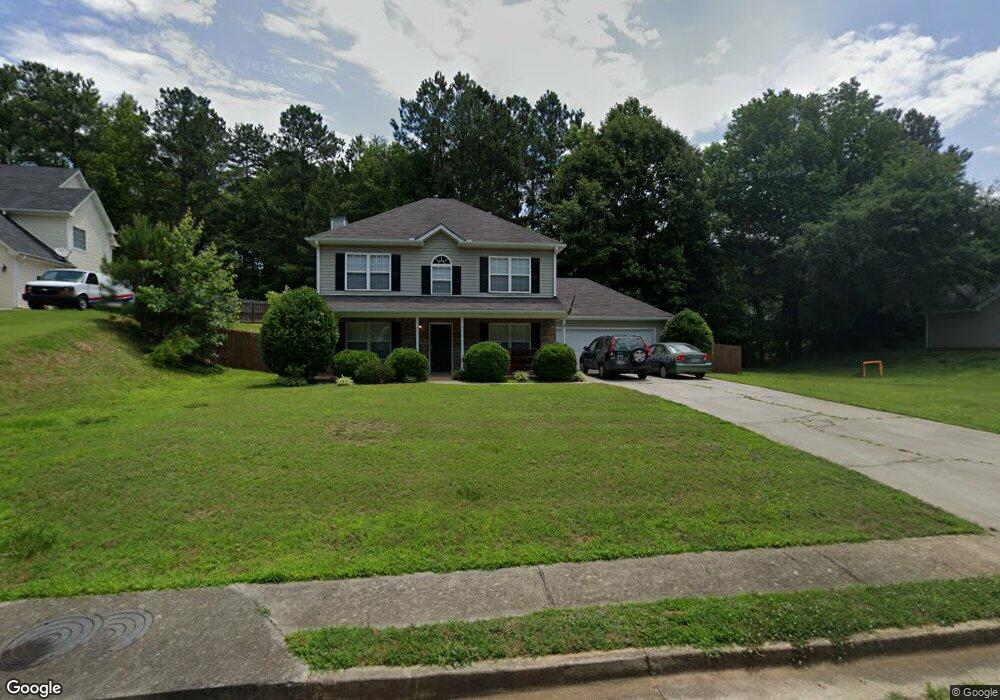
515 Lindsey Way Social Circle, GA 30025
Estimated Value: $289,155 - $324,000
3
Beds
3
Baths
1,828
Sq Ft
$169/Sq Ft
Est. Value
About This Home
This home is located at 515 Lindsey Way, Social Circle, GA 30025 and is currently estimated at $308,039, approximately $168 per square foot. 515 Lindsey Way is a home located in Walton County with nearby schools including Social Circle Primary School, Social Circle Elementary School, and Social Circle Middle School.
Ownership History
Date
Name
Owned For
Owner Type
Purchase Details
Closed on
Dec 8, 2020
Sold by
Couick Robert
Bought by
Sfr Jv 1 Property Llc
Current Estimated Value
Purchase Details
Closed on
Jun 26, 2009
Sold by
Imh Assets Corp Series 2005-2
Bought by
Couick Robert L
Home Financials for this Owner
Home Financials are based on the most recent Mortgage that was taken out on this home.
Original Mortgage
$116,325
Interest Rate
5.27%
Mortgage Type
New Conventional
Purchase Details
Closed on
Feb 3, 2009
Sold by
Myers Mark S
Bought by
Imh Assets Corp Series 2005-2
Purchase Details
Closed on
Nov 10, 2004
Sold by
Mitchland Llc
Bought by
Myers Mark S
Home Financials for this Owner
Home Financials are based on the most recent Mortgage that was taken out on this home.
Original Mortgage
$13,990
Interest Rate
5.66%
Mortgage Type
Stand Alone Refi Refinance Of Original Loan
Create a Home Valuation Report for This Property
The Home Valuation Report is an in-depth analysis detailing your home's value as well as a comparison with similar homes in the area
Home Values in the Area
Average Home Value in this Area
Purchase History
| Date | Buyer | Sale Price | Title Company |
|---|---|---|---|
| Sfr Jv 1 Property Llc | $190,000 | -- | |
| Couick Robert L | $114,000 | -- | |
| Imh Assets Corp Series 2005-2 | $107,200 | -- | |
| Myers Mark S | $139,900 | -- |
Source: Public Records
Mortgage History
| Date | Status | Borrower | Loan Amount |
|---|---|---|---|
| Previous Owner | Couick Robert L | $116,325 | |
| Previous Owner | Myers Mark S | $13,990 |
Source: Public Records
Tax History Compared to Growth
Tax History
| Year | Tax Paid | Tax Assessment Tax Assessment Total Assessment is a certain percentage of the fair market value that is determined by local assessors to be the total taxable value of land and additions on the property. | Land | Improvement |
|---|---|---|---|---|
| 2024 | $3,738 | $105,080 | $20,000 | $85,080 |
| 2023 | $1,094 | $105,080 | $20,000 | $85,080 |
| 2022 | $928 | $89,080 | $16,000 | $73,080 |
| 2021 | $748 | $71,840 | $12,000 | $59,840 |
| 2020 | $701 | $65,640 | $12,000 | $53,640 |
| 2019 | $605 | $53,320 | $10,000 | $43,320 |
| 2018 | $581 | $53,320 | $10,000 | $43,320 |
| 2017 | $2,153 | $51,520 | $10,000 | $41,520 |
| 2016 | $493 | $43,520 | $10,000 | $33,520 |
| 2015 | $424 | $37,680 | $6,000 | $31,680 |
| 2014 | $380 | $32,000 | $0 | $0 |
Source: Public Records
Map
Nearby Homes
- 443 Windsong Ln
- 1244 Morrow Dr
- 355 Conner Ct
- 2049 Emily Dr
- 967 Park Place St
- 433 Clover Dr
- 215 Park Place Trail
- 210 Park Place Trail
- The Trenton Plan at Town Park
- The Scottsdale Plan at Town Park
- 939 Park Place St
- 1007 Towne Cir
- 695 Park Place Way
- 690 Park Place Way
- 413 Crossroads Dr
- 381 Crossroads Dr
- 226 Rogue Rd
- 310 Crossroads Dr
- 357 W Hightower Trail
- 318 Richmond Dr
- 521 Lindsey Way
- 190 Windsong Dr
- 507 Lindsey Way
- 0 Windsong Dr Unit 7499890
- 0 Windsong Dr Unit 8650797
- 0 Windsong Dr Unit 8494121
- 0 Windsong Dr Unit 8213984
- 0 Windsong Dr Unit 8163445
- 0 Windsong Dr Unit 7351907
- 0 Windsong Dr Unit LOT 8+ 7009171
- 0 Windsong Dr Unit 7333696
- 0 Windsong Dr Unit 9043807
- 0 Windsong Dr Unit 8779567
- 0 Windsong Dr Unit 8879462
- 0 Windsong Dr Unit 3218617
- 0 Windsong Dr Unit 3250987
- 0 Windsong Dr Unit 7059589
- 202 Windsong Dr
- 0 Lindsey Way Unit 3236365
- 0 Lindsey Way Unit 8953040