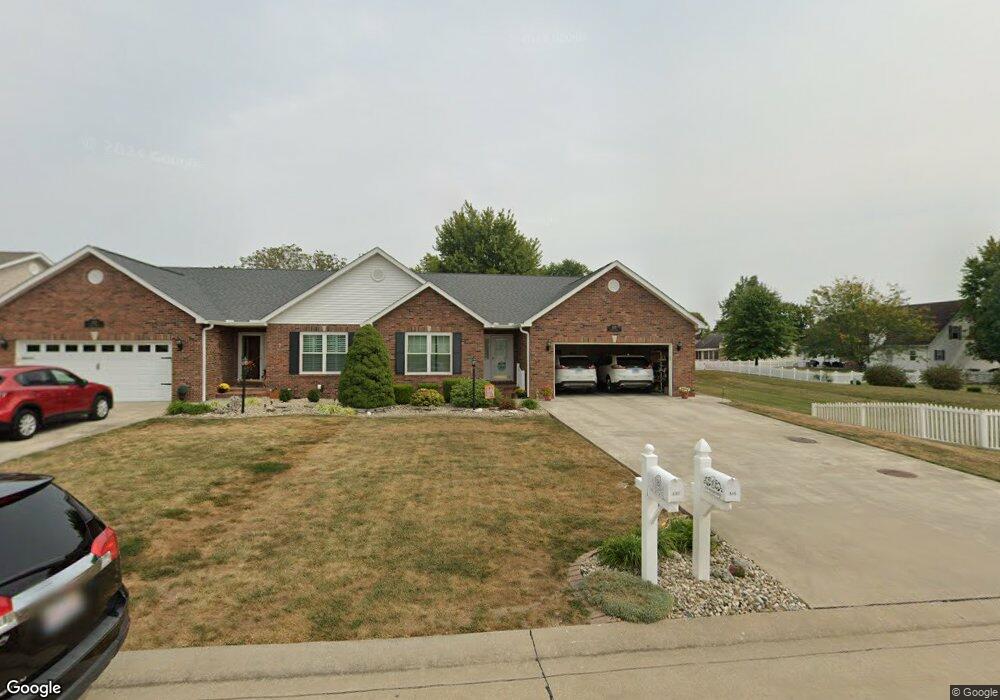
515 McDow Dr Jerseyville, IL 62052
Estimated Value: $220,000 - $257,000
3
Beds
2
Baths
1,687
Sq Ft
$142/Sq Ft
Est. Value
About This Home
This home is located at 515 McDow Dr, Jerseyville, IL 62052 and is currently estimated at $238,763, approximately $141 per square foot. 515 McDow Dr is a home located in Jersey County with nearby schools including Jersey Community High School, St Francis/Holy Ghost Catholic School, and Victory Baptist School.
Ownership History
Date
Name
Owned For
Owner Type
Purchase Details
Closed on
Mar 9, 2017
Sold by
Dial Gleason and Dial Sandra K
Bought by
Dial Marty
Current Estimated Value
Purchase Details
Closed on
Aug 15, 2011
Sold by
Brangenberg Alberta M
Bought by
Dial Gleason and Dial Sandra
Home Financials for this Owner
Home Financials are based on the most recent Mortgage that was taken out on this home.
Original Mortgage
$50,000
Interest Rate
4.55%
Create a Home Valuation Report for This Property
The Home Valuation Report is an in-depth analysis detailing your home's value as well as a comparison with similar homes in the area
Home Values in the Area
Average Home Value in this Area
Purchase History
| Date | Buyer | Sale Price | Title Company |
|---|---|---|---|
| Dial Marty | -- | Attorney | |
| Dial Gleason | -- | -- |
Source: Public Records
Mortgage History
| Date | Status | Borrower | Loan Amount |
|---|---|---|---|
| Closed | Dial Gleason | $50,000 |
Source: Public Records
Tax History Compared to Growth
Tax History
| Year | Tax Paid | Tax Assessment Tax Assessment Total Assessment is a certain percentage of the fair market value that is determined by local assessors to be the total taxable value of land and additions on the property. | Land | Improvement |
|---|---|---|---|---|
| 2024 | $3,827 | $60,435 | $8,125 | $52,310 |
| 2023 | $3,613 | $56,485 | $7,595 | $48,890 |
| 2022 | $3,432 | $52,790 | $7,100 | $45,690 |
| 2021 | $3,262 | $50,040 | $6,730 | $43,310 |
| 2020 | $3,033 | $48,115 | $6,470 | $41,645 |
| 2019 | $3,033 | $46,940 | $6,310 | $40,630 |
| 2018 | $2,931 | $46,595 | $6,265 | $40,330 |
| 2017 | $2,972 | $46,250 | $6,220 | $40,030 |
| 2016 | $2,991 | $46,575 | $6,265 | $40,310 |
| 2015 | -- | $47,285 | $6,360 | $40,925 |
| 2014 | -- | $47,355 | $6,370 | $40,985 |
Source: Public Records
Map
Nearby Homes