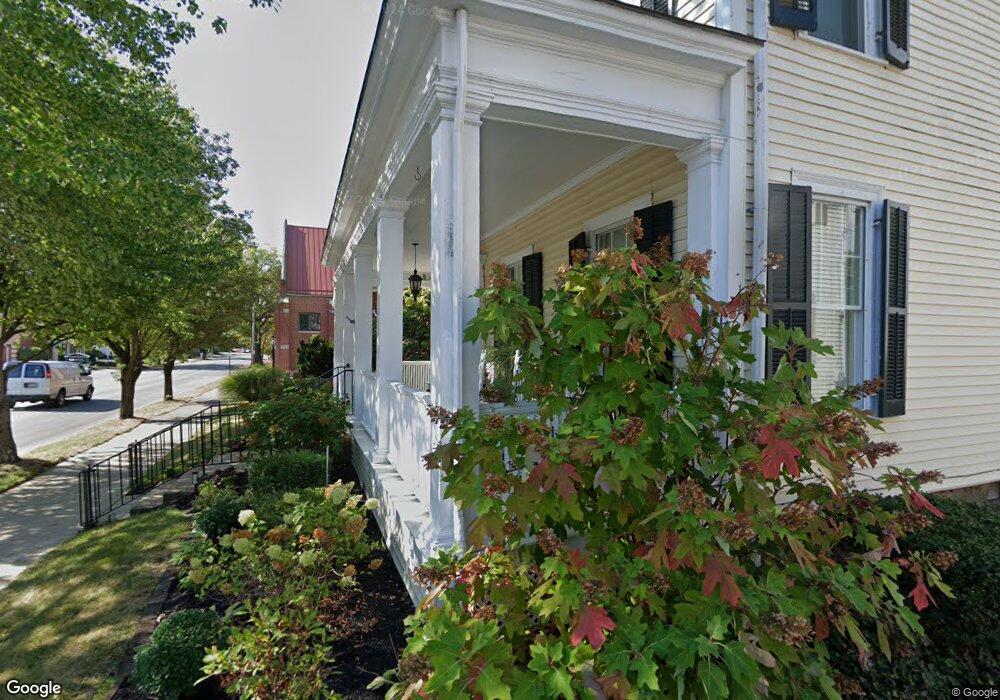
515 N Broad St Lancaster, OH 43130
Estimated Value: $392,000 - $430,000
4
Beds
3
Baths
3,708
Sq Ft
$111/Sq Ft
Est. Value
About This Home
This home is located at 515 N Broad St, Lancaster, OH 43130 and is currently estimated at $410,485, approximately $110 per square foot. 515 N Broad St is a home located in Fairfield County with nearby schools including Thomas Ewing Junior High School, Lancaster High School, and St Mary Elementary School.
Ownership History
Date
Name
Owned For
Owner Type
Purchase Details
Closed on
May 6, 2014
Sold by
Smith David S and Smith Debra G
Bought by
The David S Smith And Debra G Smith Trus
Current Estimated Value
Purchase Details
Closed on
Oct 4, 2010
Sold by
Smith Frank R and Smith David S
Bought by
Smith David S
Purchase Details
Closed on
May 5, 2010
Sold by
Estate Of Mary P Smith
Bought by
Smith Frank R and Smith David S
Create a Home Valuation Report for This Property
The Home Valuation Report is an in-depth analysis detailing your home's value as well as a comparison with similar homes in the area
Home Values in the Area
Average Home Value in this Area
Purchase History
We collect this data history from publicly available records. To have your information removed, we recommend requesting removal directly through your county’s website.
| Date | Buyer | Sale Price | Title Company |
|---|---|---|---|
| The David S Smith And Debra G Smith Trus | -- | Attorney | |
| Smith David S | -- | Attorney | |
| Smith Frank R | -- | None Available |
Source: Public Records
Tax History
| Year | Tax Paid | Tax Assessment Tax Assessment Total Assessment is a certain percentage of the fair market value that is determined by local assessors to be the total taxable value of land and additions on the property. | Land | Improvement |
|---|---|---|---|---|
| 2025 | $12,968 | $144,250 | $16,790 | $127,460 |
| 2024 | $8,456 | $94,060 | $8,710 | $85,350 |
| 2023 | $3,087 | $94,060 | $8,710 | $85,350 |
| 2022 | $3,115 | $94,060 | $8,710 | $85,350 |
| 2021 | $2,491 | $72,660 | $8,710 | $63,950 |
| 2020 | $2,387 | $72,660 | $8,710 | $63,950 |
| 2019 | $2,269 | $72,660 | $8,710 | $63,950 |
| 2018 | $1,596 | $62,770 | $8,710 | $54,060 |
| 2017 | $1,597 | $51,460 | $5,180 | $46,280 |
| 2016 | $1,556 | $51,460 | $5,180 | $46,280 |
| 2015 | $1,528 | $49,460 | $5,180 | $44,280 |
| 2014 | $1,455 | $49,460 | $5,180 | $44,280 |
| 2013 | $1,455 | $49,460 | $5,180 | $44,280 |
Source: Public Records
Map
Nearby Homes
- 626 N Broad St
- 424 N Columbus St
- 515 N Columbus St
- 627 N Columbus St
- 430 N High St
- 130 W Fair Ave
- 311 E Allen St
- 338 King St
- 0 Slocum Ave
- 246 N Pearl Ave
- 806 N High St
- 338 E Mulberry St
- 308 Reber Ave
- 308 Reber Ave Unit 310
- 154 E Main St
- 617 N Maple St
- 222 Park St
- 0 N Columbus St
- 430 W Mulberry St
- 330 Park St
- 521 N Broad St
- 523 1/2 N Broad St
- 529 N Broad St
- 537 N Broad St
- 120 W 6th Ave
- 509 N Broad St
- 124 W 6th Ave
- 115 W 6th Ave
- 526 N Broad St
- 0 W Sixth Ave
- 0 W Sixth Avenue Lot 5
- 0 W Sixth Avenue Lot 6
- 0 W Sixth Avenue Lot 7
- 132 W 6th Ave
- 95 W 5th Ave
- 125 W 5th Ave
- 520 N Broad St
- 524 N Broad St
- 522 N Broad St
- 121 W 6th Ave
Your Personal Tour Guide
Ask me questions while you tour the home.