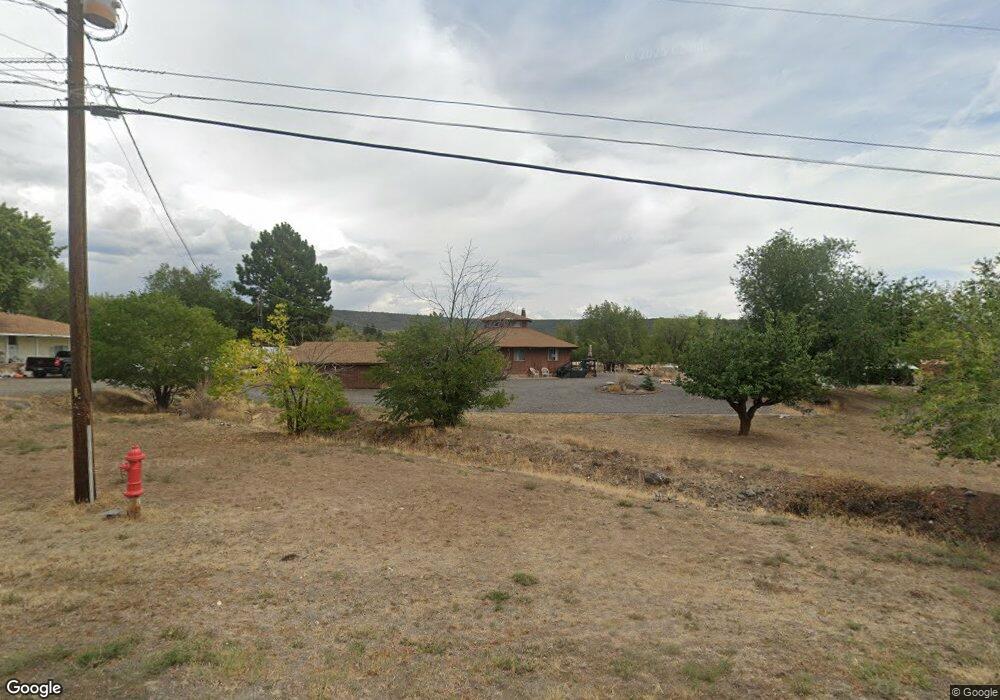
515 N Grand Mesa Dr Cedaredge, CO 81413
Estimated Value: $376,816 - $421,000
3
Beds
2
Baths
1,590
Sq Ft
$253/Sq Ft
Est. Value
About This Home
This home is located at 515 N Grand Mesa Dr, Cedaredge, CO 81413 and is currently estimated at $402,954, approximately $253 per square foot. 515 N Grand Mesa Dr is a home located in Delta County with nearby schools including Cedaredge Elementary School, Cedaredge Middle School, and Cedaredge High School.
Ownership History
Date
Name
Owned For
Owner Type
Purchase Details
Closed on
Aug 12, 2020
Sold by
Rogers Donna R
Bought by
Deverick Patrick and Deverick Beth
Current Estimated Value
Home Financials for this Owner
Home Financials are based on the most recent Mortgage that was taken out on this home.
Original Mortgage
$276,892
Outstanding Balance
$245,623
Interest Rate
3%
Mortgage Type
FHA
Estimated Equity
$157,331
Purchase Details
Closed on
Apr 27, 2016
Sold by
Draney Sara
Bought by
Rogers Donna R
Home Financials for this Owner
Home Financials are based on the most recent Mortgage that was taken out on this home.
Original Mortgage
$133,676
Interest Rate
3.71%
Mortgage Type
New Conventional
Purchase Details
Closed on
May 9, 1994
Sold by
Draney
Bought by
Rogers Donna R and Rogers Gregory
Purchase Details
Closed on
Aug 1, 1991
Sold by
Price
Bought by
Draney Rogers Donna R and Draney Rogers
Create a Home Valuation Report for This Property
The Home Valuation Report is an in-depth analysis detailing your home's value as well as a comparison with similar homes in the area
Home Values in the Area
Average Home Value in this Area
Purchase History
| Date | Buyer | Sale Price | Title Company |
|---|---|---|---|
| Deverick Patrick | $282,000 | Heritage Title Company | |
| Rogers Donna R | $130,000 | Heritage Title | |
| Rogers Donna R | $57,500 | -- | |
| Draney Rogers Donna R | $64,900 | -- |
Source: Public Records
Mortgage History
| Date | Status | Borrower | Loan Amount |
|---|---|---|---|
| Open | Deverick Patrick | $276,892 | |
| Previous Owner | Rogers Donna R | $133,676 |
Source: Public Records
Tax History Compared to Growth
Tax History
| Year | Tax Paid | Tax Assessment Tax Assessment Total Assessment is a certain percentage of the fair market value that is determined by local assessors to be the total taxable value of land and additions on the property. | Land | Improvement |
|---|---|---|---|---|
| 2024 | $1,213 | $17,805 | $2,220 | $15,585 |
| 2023 | $1,213 | $17,805 | $2,220 | $15,585 |
| 2022 | $944 | $14,097 | $2,016 | $12,081 |
| 2021 | $941 | $14,502 | $2,074 | $12,428 |
| 2020 | $728 | $10,893 | $1,845 | $9,048 |
| 2019 | $727 | $10,893 | $1,845 | $9,048 |
| 2018 | $668 | $9,547 | $1,800 | $7,747 |
| 2017 | $668 | $9,547 | $1,800 | $7,747 |
| 2016 | $359 | $11,137 | $2,189 | $8,948 |
| 2014 | -- | $11,211 | $2,348 | $8,863 |
Source: Public Records
Map
Nearby Homes
- 565 N Grand Mesa Dr
- 635 NE 2nd St
- 800 NE 2nd St
- 435 NE 4th St
- 480 NW Cedar Ave
- 365 NW Cedar Ave
- 377 NE Indian Camp Ave
- 325 NE 4th St
- 470 NW Cedar Ave
- 345 1/2 NW 4th St
- 215 N Grand Mesa Dr
- 245 NW 3rd St
- 225 NW 4th St
- 285 NW 7th St
- 395 NW 7th St
- 590 NW Aspen
- 765 NW Cedar Ave
- 490 W Main St
- 190 & 170 SW 2nd Ave Unit A, B, C
- 633 E Main St
- 525 N Grand Mesa Dr
- 485 N Grand Mesa Dr
- 515 NW 2nd St
- 515 NW 2nd St
- 525 NW 2nd St
- 0 NW 2nd St Unit 761058
- 0 NW 2nd St Unit 759910
- 0 NW 2nd St Unit 749247
- 0 NW 2nd St Unit 745942
- 0 NW 2nd St Unit 660044
- 0 NW 2nd St Unit 691627
- 0 NW 2nd St Unit 631969
- 0 NW 2nd St Unit 671759
- 0 NW 2nd St Unit 676105
- 0 NW 2nd St Unit 732475
- 0 NW 2nd St Unit 732192
- 0 NW 2nd St Unit 612241
- 0 NW 2nd St Unit 631059
- 0 NW 2nd St Unit 631966
- 0 NW 2nd St Unit 660612