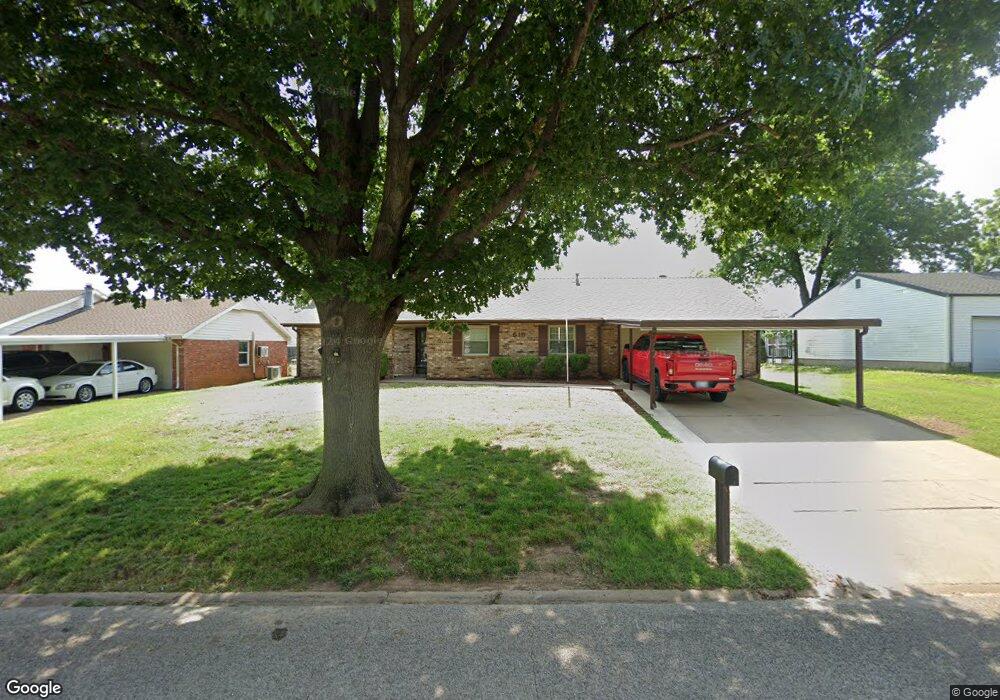
515 N Olympia St Ponca City, OK 74601
Estimated Value: $168,324 - $192,000
3
Beds
2
Baths
1,504
Sq Ft
$119/Sq Ft
Est. Value
About This Home
This home is located at 515 N Olympia St, Ponca City, OK 74601 and is currently estimated at $178,331, approximately $118 per square foot. 515 N Olympia St is a home located in Kay County with nearby schools including Lincoln Elementary School, Ponca City West Middle School, and Ponca City East Middle School.
Ownership History
Date
Name
Owned For
Owner Type
Purchase Details
Closed on
Apr 20, 2022
Sold by
Kampman Leo R
Bought by
Kampman Leo R and Kampman Joseph F
Current Estimated Value
Purchase Details
Closed on
Dec 28, 2021
Sold by
Maher Walter E and Maher Kimberly A
Bought by
Garcia Debra and Garcia Vanessa
Purchase Details
Closed on
Jan 7, 2019
Sold by
Hurd Mark L and Hurd Lora A
Bought by
Kampman Leo R
Home Financials for this Owner
Home Financials are based on the most recent Mortgage that was taken out on this home.
Original Mortgage
$123,000
Interest Rate
4.7%
Mortgage Type
VA
Purchase Details
Closed on
Oct 30, 2017
Sold by
Hurd Mark L and Hurd Jenelean M
Bought by
Hurd Mark L and Hurd Jerelean M
Purchase Details
Closed on
Nov 22, 2010
Sold by
Hund Marhil and Hund Poam M
Bought by
Hurd Mouh L and Hurd Jere Poan M
Purchase Details
Closed on
Oct 11, 2009
Sold by
Hard Mark L and Hard Jenalean M
Bought by
Hard Mark Lee and Mchard Jean Mc
Create a Home Valuation Report for This Property
The Home Valuation Report is an in-depth analysis detailing your home's value as well as a comparison with similar homes in the area
Home Values in the Area
Average Home Value in this Area
Purchase History
| Date | Buyer | Sale Price | Title Company |
|---|---|---|---|
| Kampman Leo R | -- | None Listed On Document | |
| Garcia Debra | $153,000 | None Available | |
| Kampman Leo R | $123,000 | Stewart Escrow & Title | |
| Hurd Mark L | -- | None Available | |
| Hurd Mouh L | -- | -- | |
| Hard Mark Lee | -- | -- |
Source: Public Records
Mortgage History
| Date | Status | Borrower | Loan Amount |
|---|---|---|---|
| Previous Owner | Kampman Leo R | $123,000 |
Source: Public Records
Tax History Compared to Growth
Tax History
| Year | Tax Paid | Tax Assessment Tax Assessment Total Assessment is a certain percentage of the fair market value that is determined by local assessors to be the total taxable value of land and additions on the property. | Land | Improvement |
|---|---|---|---|---|
| 2024 | -- | $15,173 | $1,418 | $13,755 |
| 2023 | $0 | $14,731 | $1,418 | $13,313 |
| 2022 | $0 | $14,201 | $1,418 | $12,783 |
| 2021 | $0 | $13,530 | $1,418 | $12,112 |
| 2020 | $0 | $13,530 | $1,418 | $12,112 |
| 2019 | $764 | $7,996 | $746 | $7,250 |
| 2018 | $694 | $8,169 | $746 | $7,423 |
| 2017 | $720 | $8,351 | $746 | $7,605 |
| 2016 | $714 | $8,208 | $746 | $7,462 |
| 2015 | $698 | $8,018 | $746 | $7,272 |
| 2014 | $688 | $8,049 | $678 | $7,371 |
Source: Public Records
Map
Nearby Homes
- 312 N Flormable St
- 1504 W Broadway Ave
- 400 Hampton Dr
- 1035 N Sunset St
- 508 N Birch St
- 1023 W Grand Ave
- 330 S Lincoln St
- 802 N Ash St
- 726 N Lake St
- 901 W Grand Ave
- 329 S Sunset St
- 745 N Lake St
- 941 N Ash St
- 429 S Sunset St
- 1021 Riviera Dr
- 1016 N Oak St
- 505 N Pine St
- 411 S Elm St
- 1708 Potomac Dr
- 4025 S Union St
- 517 N Olympia St
- 509 N Olympia St
- 545 Airline Dr
- 547 Airline Dr
- 543 Airline Dr
- 549 Airline Dr
- 541 Airline Dr
- 505 N Olympia St
- 512 N Olympia St
- 539 Airline Dr
- 516 N Olympia St
- 508 N Olympia St
- 537 Airline Dr
- 504 N Olympia St
- 501 N Olympia St
- 535 Airline Dr
- 542 Airline Dr
- 540 Airline Dr
- 500 N Olympia St
- 538 Airline Dr