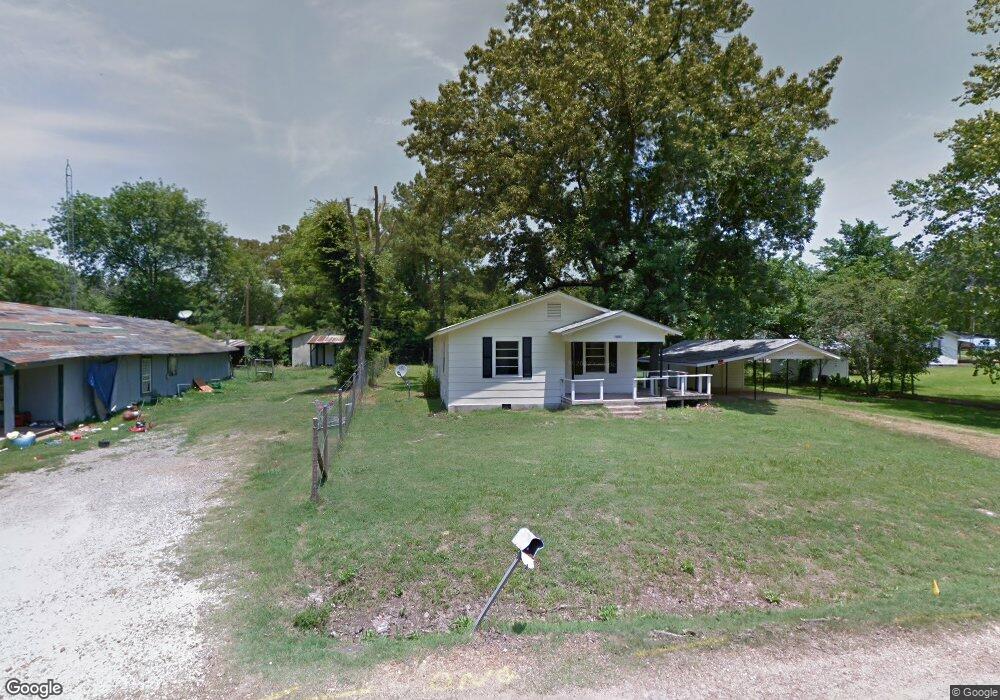
515 NE 3rd St Antlers, OK 74523
Estimated Value: $66,263 - $141,000
2
Beds
1
Bath
992
Sq Ft
$100/Sq Ft
Est. Value
About This Home
This home is located at 515 NE 3rd St, Antlers, OK 74523 and is currently estimated at $98,816, approximately $99 per square foot. 515 NE 3rd St is a home located in Pushmataha County with nearby schools including Brantly Elementary School, Obuch Middle School, and Antlers High School.
Ownership History
Date
Name
Owned For
Owner Type
Purchase Details
Closed on
Feb 26, 2014
Sold by
Garcia Frank
Bought by
Pool L C
Current Estimated Value
Purchase Details
Closed on
Jun 17, 2011
Sold by
Southwest Property Invest
Bought by
Smith Brent L
Purchase Details
Closed on
Oct 14, 2009
Sold by
Deerly Lester
Bought by
Southwest Property Invest
Purchase Details
Closed on
Aug 23, 2001
Sold by
Simmons Ancil O
Bought by
Deerly Lester
Purchase Details
Closed on
Jul 31, 1996
Sold by
Morford Merrill
Bought by
Simmons Ancil O
Purchase Details
Closed on
Aug 14, 1995
Sold by
Rider Rebecca Ann Sunday
Bought by
Morford Merrill
Create a Home Valuation Report for This Property
The Home Valuation Report is an in-depth analysis detailing your home's value as well as a comparison with similar homes in the area
Home Values in the Area
Average Home Value in this Area
Purchase History
| Date | Buyer | Sale Price | Title Company |
|---|---|---|---|
| Pool L C | $30,000 | -- | |
| Garcia Frank | $27,000 | -- | |
| Smith Brent L | $4,500 | -- | |
| Southwest Property Invest | -- | -- | |
| Deerly Lester | $29,000 | -- | |
| Simmons Ancil O | $17,500 | -- | |
| Morford Merrill | $18,000 | -- |
Source: Public Records
Tax History Compared to Growth
Tax History
| Year | Tax Paid | Tax Assessment Tax Assessment Total Assessment is a certain percentage of the fair market value that is determined by local assessors to be the total taxable value of land and additions on the property. | Land | Improvement |
|---|---|---|---|---|
| 2025 | $194 | $3,652 | $440 | $3,212 |
| 2024 | $194 | $3,652 | $440 | $3,212 |
| 2023 | $180 | $3,443 | $440 | $3,003 |
| 2022 | $172 | $3,342 | $440 | $2,902 |
| 2021 | $172 | $3,342 | $440 | $2,902 |
| 2020 | $172 | $3,342 | $440 | $2,902 |
| 2019 | $170 | $3,313 | $440 | $2,873 |
| 2018 | $163 | $3,217 | $440 | $2,777 |
| 2017 | $167 | $3,272 | $440 | $2,832 |
| 2016 | $167 | $3,272 | $440 | $2,832 |
| 2015 | $169 | $3,300 | $440 | $2,860 |
| 2014 | $234 | $3,187 | $377 | $2,810 |
Source: Public Records
Map
Nearby Homes